何をお探しですか?
アプリケーション/ネットワーク・パフォーマンス・モニタリング
合成APMとNPMツールでネットワークとアプリケーションをプロアクティブに監視する
合成モニタリングで中断を最小限に
合成ネットワーク・パフォーマンス・モニタリング (NPM)およびアプリケーション・パフォーマンス・モニタリング (APM)ツールにより、実環境のトラフィックをシミュレートし、ネットワーク、ウェブサイト、およびアプリケーションの応答時間を追跡し、ユーザーが使用する前に問題点を見つけることができます。
ネットワーク/アプリケーション・パフォーマンス・モニタリング・ソフトウェアの詳細
合成モニタリングとは
ライブネットワークとアプリケーショントラフィックに依存する現実のリアル・ユーザー・モニタリング(RUM)ツールとは異なり、合成モニタリングツールにより、シミュレートされたアプリケーショントラフィックを生成し、ネットワークとアプリケーションに送信し、意図した宛先に到達するまでにかかる時間を測定します。 継続的テストをすることで、ネットワーク運用チームとアプリケーション・デリバリー・チームは、さまざまな条件下でQoEとサービス品質(QoS)を監視でき、サービス低下、ネットワーク/アプリケーションのレイテンシやボトルネックの特定に役立ちます。
合成APM/NPMツールで何ができますか。
ネットワークレイテンシを防ぎ、一貫したQoSを確保
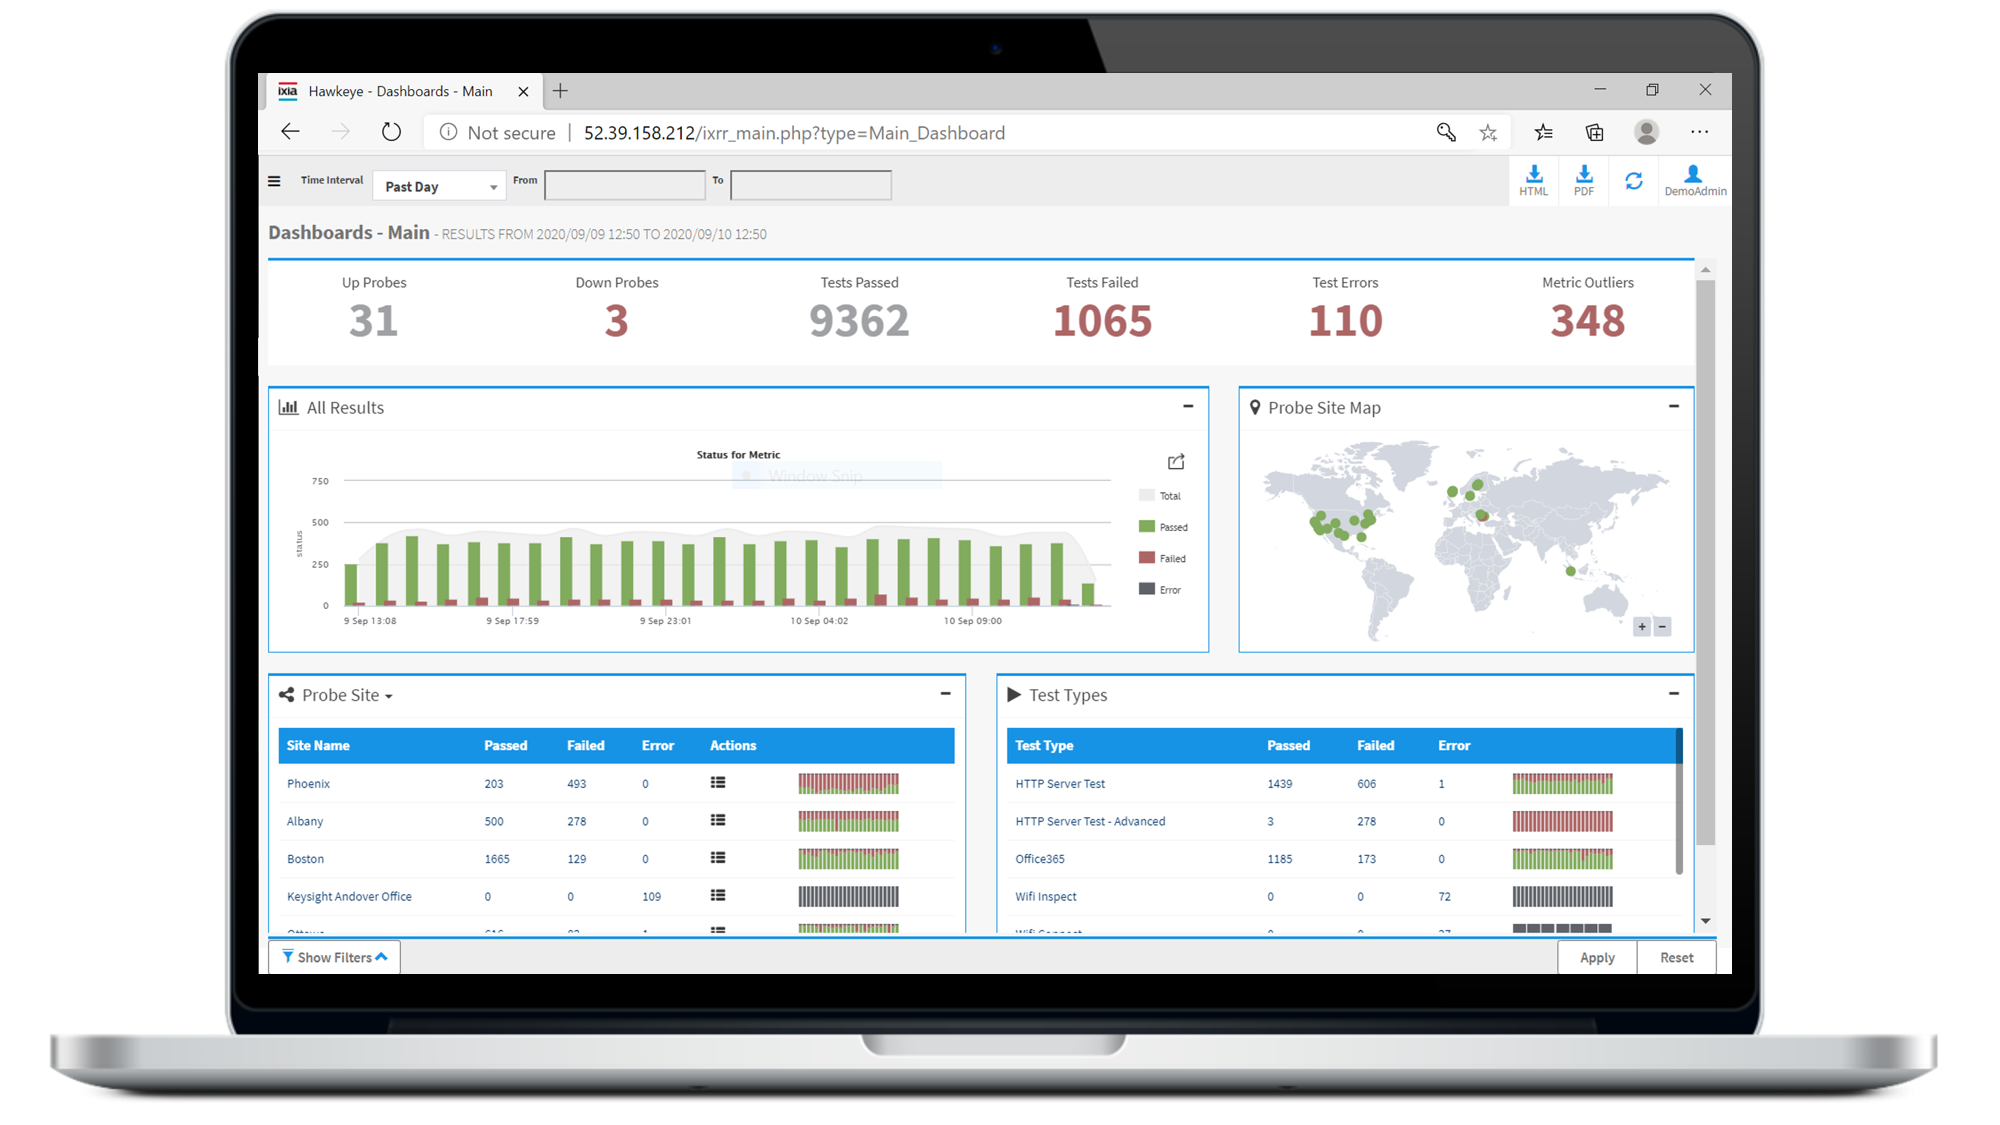
ボトルネック、レイテンシ、Wi-Fi問題、また他に特定が難しい問題によって、ネットワークサービス(統合通信、VoIP、SaaS、ビジネスアプリケーションなど)や性能が損なわれないようにしましょう。 Hawkeyeはネットワーク性能を監視し、問題を切り分け、さまざまな実環境トラフィックロード、相互作用、アプリケーション混合をエミュレートすることで、スケジュールされた検証テストを実行し問題をプロアクティブに検出します。 AIを活用した外れ値検出と 合否判定指標によりトラブルシューティングの優先順位を付け、また、ホップ・バイ・ホップ解析により、根本原因の分析と問題領域の修正が容易になります。


すべてのモバイルユーザーに一貫した体験を維持
モバイルアプリケーションやウェブサイトでQoSを維持するには、従来のアプリケーション性能モニタリング以上のものが必要です。 つまり、デバイス、オペレーティングシステムなど、さまざまなものを管理するということです。 Eggplant監視は、AppleとAndroidの環境において、画面解像度、アップロード、ダウンロード、ネットワークレイテンシをエミュレートし、全てのアクセス可能なシステム、ウェブサイト、アプリケーションでの一貫したモバイル体験と機能を確保することができます。


コアからエッジまトラブルシューティングの高速化とサービス品質の最適化
複雑なトポロジーやブラインドスポットで、分離されたハイブリッドネットワークでのQoSを維持する能力に影響を与えないようにしましょう。 主要なコンピュートリソースとワークロードがクラウドからネットワークのエッジに移行するにつれて、ネットワーク運用チームは、性能の低下を検出し、その根本原因を特定するための合成NPM ツールが必要です。 さまざまなハードウェアとソフトウェアベースのネットワークエンドポイントによって、Hawkeyeはエンドツーエンドのサービスチェックをコアからエッジまで行うことができます。 同時に、ノード・ツー・ノードトラフィック可視化により、トラブルシューティングを加速化しエンジニアの派遣を最小限にします。
ウェブサイトとAppをユーザー視点で監視
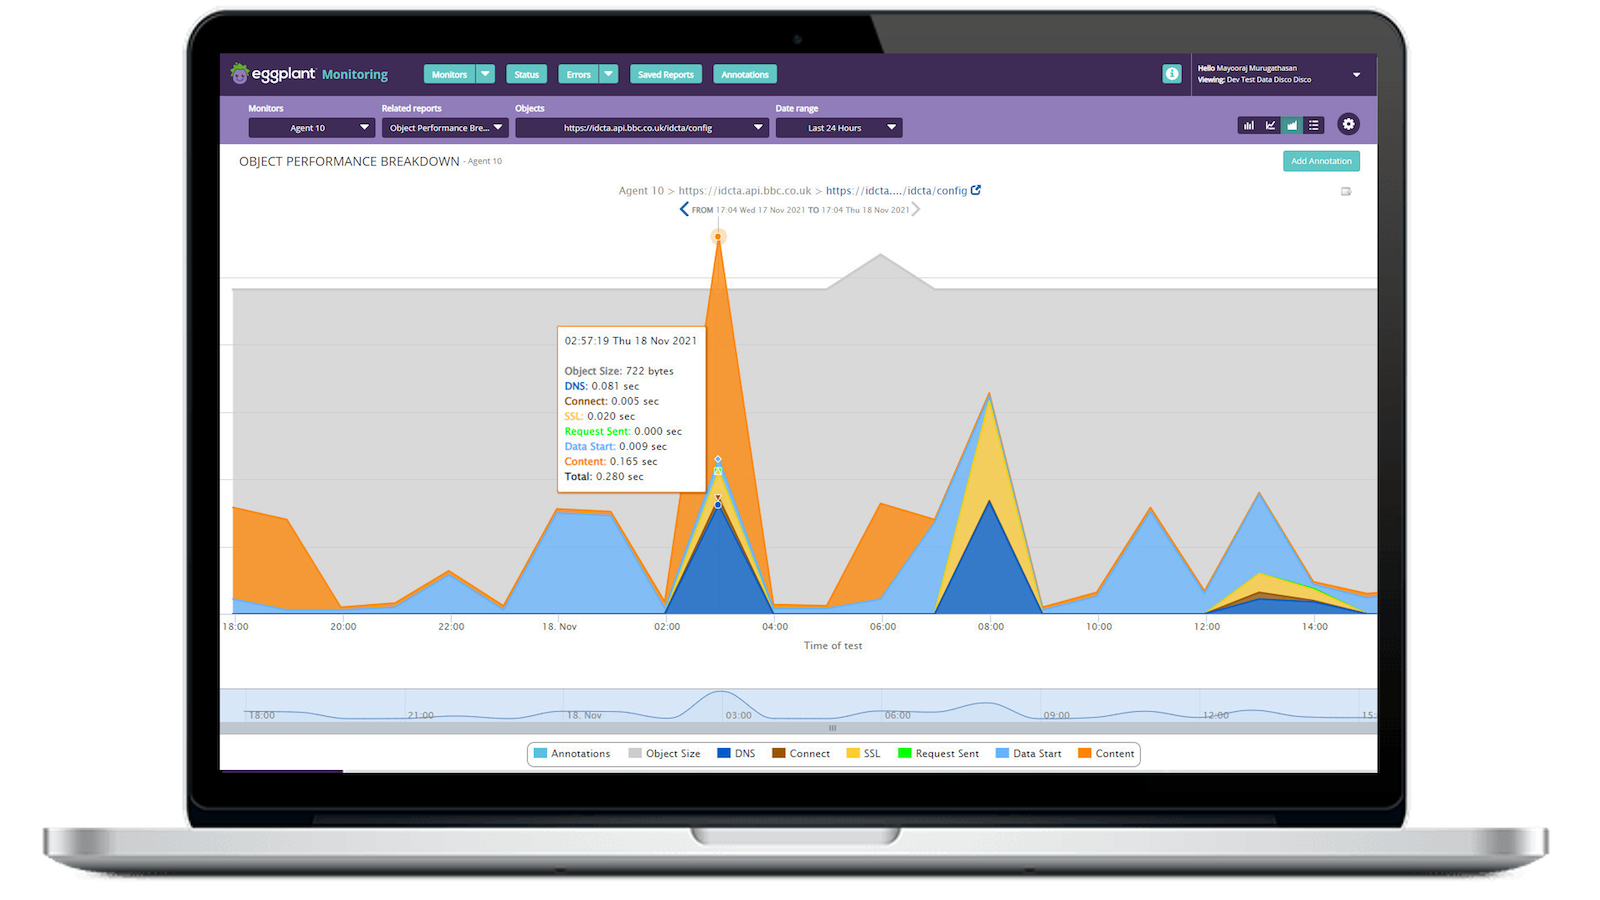
大きなJavaScriptファイル、非圧縮画像、動画など、ウェブベースの性能低下を最小限に抑えます。 Eggplant監視は、ユーザー動作をエミュレートし、Webサイトやアプリケーションのロード時間、ダウンロード速度、その他のUX関連の性能指標を継続的にテストします。 クライアント側の要因(再試行ロジックや変数のパラメータ化)と、API、モバイル、FTP、2要素認証などのバックエンド相互作用をシミュレートして、カスタマージャーニーを可視化し、ボトルネックを特定し、最適化の機会を特定します。


アプリケーション/ネットワーク・パフォーマンス・モニタリング・ソフトウェアに関するよくある質問
What is network performance monitoring (NPM)?
Network performance monitoring (NPM) tools enable you to visualize, monitor, troubleshoot, and maximize a given network's performance, availability, and quality of service.
These tools operate one of two ways: reporting live network traffic or generating synthetic traffic and sending it across the network to various hardware- or software-based endpoints. Frequently, these tools display critical metrics and KPIs such as packet loss, jitter, delay, response time, and mean opinion score. A highly-visual, real-time dashboard utilizing AI or machine learning makes it easy for network operations teams to identify outliers and potential issues to follow up on.
What is application performance monitoring (APM)?
Application performance monitoring (APM) tools enable IT personnel and DevOps teams to ensure enterprise and customer-facing applications meet users' expected performance, reliability, and user experience (UX) goals.
APM tools generally fall into one of two categories: real user monitoring (RUM) or synthetic monitoring. RUM platforms capture and report on traffic metrics and performance checks derived from real application users — providing real-time insights into UX and performance. Conversely, synthetic monitoring tools emulate user interactions to benchmark application performance under various conditions and scenarios — enabling operations teams to identify and remediate potential bottlenecks faster.
What is synthetic monitoring?
Traditional monitoring tools rely on actual traffic data, sometimes called passive data. Synthetic monitoring (active monitoring) tools generate simulated application traffic, inject it into your network, and capture key performance indicators. Running simulations lets you observe your network's performance under various conditions and note where performance does not meet expectations.
The process is active because you control the type and mix of applications and the traffic volume in each simulation. Since your monitoring tool is not dependent on live traffic, you can anticipate performance problems and test the impact of potential fixes. You move from being passive and reactive to being proactive.
How can you use synthetic monitoring tools?
Synthetic monitoring is excellent for assessing network readiness before deploying SD-WAN, distributed unified communications, cloud applications, or voice and video services like Microsoft Teams or Zoom. Since these tools rely on simulated traffic to measure response time, quality, or latency, you can predict performance and pinpoint bottlenecks before going live. Moreover, most industry-leading tools offer a library of application signatures — enabling you to build highly accurate tests with the exact type of traffic you expect while varying the volume to model changes in demand.
A flexible monitoring platform lets you simulate traffic from various endpoints across your distributed network, so that you can measure performance in a wide range of operating scenarios. You can test node-to-node connections in a distributed network, validate end-user experience using cloud-based applications, or ensure large-scale network deployments are ready for release.
In addition to pre-deployment and live network assessments, you can also use continuous active monitoring to proactively maintain QoS. Tracking daily simulation results makes it easy to identify deviations from the norm — giving you an early indication of when performance falls below minimum service levels.
ご要望、ご質問はございませんか。