Toggle Menu
Confirme o seu país ou área
Por Favor, Confirme
Confirme o seu país para ter acesso a informações sobre preços aplicáveis, ofertas especiais, eventos e contatos.
Confirme o seu país ou área
Por Favor, Confirme
Confirme o seu país para ter acesso a informações sobre preços aplicáveis, ofertas especiais, eventos e contatos.
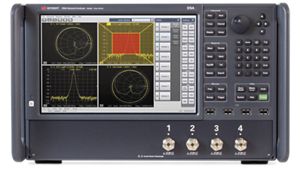
This course demystifies the complexity of the Smith chart and demonstrates how a VNA can be used to characterize a paperclip on the Smith chart.
Learn: