Toggle Menu
Bestätigen Sie Ihr Land oder Gebiet
Bitte bestätigen
Bestätigen Sie Ihr Land, damit Sie die für Sie zutreffenden Informationen über Preise, Sonderangebote, Veranstaltungen und Kontaktdaten erhalten.
Bestätigen Sie Ihr Land oder Gebiet
Bitte bestätigen
Bestätigen Sie Ihr Land, damit Sie die für Sie zutreffenden Informationen über Preise, Sonderangebote, Veranstaltungen und Kontaktdaten erhalten.
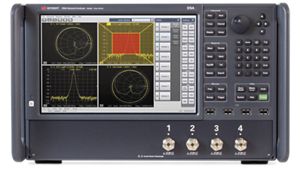
This course demystifies the complexity of the Smith chart and demonstrates how a VNA can be used to characterize a paperclip on the Smith chart.
Learn: