

Title
t<sub>r</sub> ≈ 0.35 / BW (for Gaussian systems)
Resource Guide
How to Trace a Bandwidth Number

Introduction
You’ve got a signal on the screen, the specs call for a certain bandwidth, and your customer wants proof the design holds up under real-world conditions. But when you go to verify the bandwidth, the numbers don’t quite line up or worse, they fluctuate depending on your setup, tool, or interpretation method.
Sound familiar? Engineers working in RF, high-speed digital, or power electronics often face this same frustration: bandwidth matters, but tracing it accurately isn’t always straightforward.
Whether you're troubleshooting unexpected roll-off, validating a prototype, or preparing for compliance testing, you need to understand what your tools are really telling you.
In this guide, you will learn how to trace a bandwidth number confidently and consistently. We’ll walk through bandwidth fundamentals, show you which instruments and software help eliminate guesswork, and outline clear steps for measuring and interpreting bandwidth in the lab.
You will also find tips for avoiding common pitfalls and real-world examples across industries. If you're looking to sharpen your testing process or invest in tools that help you do it faster and better, this is where to start.
Bandwidth Fundamentals
In electrical engineering, bandwidth refers to the range of frequencies a system or component can handle. It defines how well a signal can pass through a circuit or device without significant loss or distortion, critical for analyzing performance across RF, high-speed digital, and analog systems.
There are two common types of bandwidth measurements:
- Absolute bandwidth, the span between the lowest and highest frequencies a system passes.
- Relative bandwidth, which considers bandwidth in relation to a center frequency, useful in communication systems.
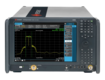
Most tools determine bandwidth using the 3 dB point, where signal power drops to half of its peak value. Understanding the cutoff frequency is essential for accurate measurements, especially when using oscilloscopes or filters.
Bandwidth plays a key role in several engineering tasks:
- Signal integrity analysis, where low bandwidth can hide rise-time issues or signal distortion.
- Filter design, where bandwidth defines passband and stopband performance.
- Data transmission, since broader bandwidth supports higher data rates and modulation complexity.
- System performance evaluation, especially in wideband or fast-switching environments.
Common units include Hz, kHz, MHz, and GHz, and conversions between them are straightforward. You will often need to calculate bandwidth directly. Formulas and examples are available in this bandwidth formula guide.
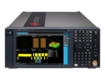
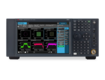
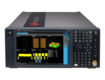
To measure bandwidth practically, tools like oscilloscopes, spectrum analyzers, and network analyzers come into play.
Here’s a reference table showing how bandwidth connects to other electrical parameters:
| Parameter | Relationship to Bandwidth |
|---|---|
| Rise Time (tr) | tr ≈ 0.35 / BW (for Gaussian systems) |
| Data Rate | Higher data rate → higher required BW |
| Filter Sharpness | Narrow BW = higher selectivity |
| Signal Fidelity | Limited BW can distort fast signals at low sample rate |
Parameter
Relationship to Bandwidth
Rise Time (tr)
Data Rate
Title
Higher data rate → higher required BW
Higher data rate → higher required BW
Filter Sharpness
Title
Narrow BW = higher selectivity
Narrow BW = higher selectivity
Signal Fidelity
Title
Limited BW can distort fast signals at low sample rate
Limited BW can distort fast signals at low sample rate
Understanding these relationships helps you select the right equipment and interpret results more accurately, especially when working near the performance limits of your system.
Essential Equipment for Bandwidth Tracing
Accurately tracing bandwidth requires the right combination of signal analysis tools, supporting hardware, and software solutions.
Key considerations include measurement range, resolution, input type, and system compatibility. Engineers should weigh trade-offs between flexibility, precision, and cost, especially when evaluating test setups for RF, digital, or mixed-signal applications.
You can explore detailed buying resources for spectrum analyzers, network analyzers, and oscilloscopes to guide your selection process.
Signal Analysis Tools
Bandwidth tracing starts with reliable measurement instruments:
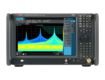
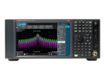
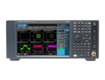
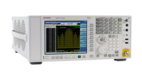
- Spectrum analyzers provide frequency-domain visibility, ideal for wideband and RF signal analysis. Learn how they work in this spectrum analyzer guide.
- Network analyzers are critical for S-parameter and transfer function measurements, particularly in RF, microwave, and filter design. For a tool comparison, see network analyzer vs. spectrum analyzer.
- Oscilloscopes are useful for time-domain bandwidth analysis but limited by their own rated bandwidth and sampling rate.
- Digital Signal Processing (DSP) platforms allow for deeper post-analysis, such as FFT or custom bandwidth estimation.
Each instrument type serves a distinct use case, so choosing based on your signal type and measurement goal is essential.
Supporting Test Equipment
Bandwidth measurements often require controlled signal injection and low-noise setups:
- Signal generators provide stable, configurable test signals. See this signal generator buying guide and overview of how they work.
- Attenuators and matching networks help control signal amplitude and minimize reflection.
- Calibration kits and standards are essential for traceable, repeatable measurements.
- Data acquisition systems capture signals across multiple channels with synchronization and precision timing.
As one Keysight account manager put it: “I like used equipment, because sometimes I can sell a newer or better product that’s used for the same price of a new one.”
Software Solutions
Software can streamline setup, automate measurements, and expand analysis:
- Spectrum analysis software enables signal capture, visualization, and automated bandwidth calculation across various instruments.
- MATLAB and similar tools offer mathematical modeling, filtering, FFT, and signal characterization, ideal for complex or simulated bandwidth analysis.
- Circuit simulation software allows for virtual bandwidth testing and pre-layout signal analysis.
- Custom applications can be developed for test automation, repeatable workflows, and report generation.
Software adds flexibility and depth to hardware-limited environments, especially when working with large datasets or unconventional signal structures.
Recommended Equipment Specifications by Application Type
| Application Type | Recommended Equipment | Key Specs to Prioritize |
|---|---|---|
| RF Circuit Testing | Spectrum analyzer, signal generator | ≥ 3 GHz BW, low phase noise, fast sweep time |
| High-Speed Digital | Oscilloscope, DSP software | ≥ 2.5 GHz BW, high sample rate, jitter tools |
| Filter Design | Network analyzer, calibration kit | S21/S11 support, >10 dB dynamic range, low noise |
| Power Electronics | Oscilloscope, signal generator, matching network | ≥ 100 MHz BW, low distortion, high voltage input |
| Audio/System Validation | DAQ system, circuit simulation software | Flat response in 20 Hz–20 kHz, low THD+N |
Application Type
Recommended Equipment
Key Specs to Prioritize
RF Circuit Testing
Title
Spectrum analyzer, signal generator
Spectrum analyzer, signal generator
Title
≥ 3 GHz BW, low phase noise, fast sweep time
≥ 3 GHz BW, low phase noise, fast sweep time
High-Speed Digital
Title
Oscilloscope, DSP software
Oscilloscope, DSP software
Title
≥ 2.5 GHz BW, high sample rate, jitter tools
≥ 2.5 GHz BW, high sample rate, jitter tools
Filter Design
Title
Network analyzer, calibration kit
Network analyzer, calibration kit
Title
S21/S11 support, >10 dB dynamic range, low noise
S21/S11 support, >10 dB dynamic range, low noise
Power Electronics
Title
Oscilloscope, signal generator, matching network
Oscilloscope, signal generator, matching network
Title
≥ 100 MHz BW, low distortion, high voltage input
≥ 100 MHz BW, low distortion, high voltage input
Audio/System Validation
Title
DAQ system, circuit simulation software
DAQ system, circuit simulation software
Title
Flat response in 20 Hz–20 kHz, low THD+N
Flat response in 20 Hz–20 kHz, low THD+N
Matching equipment specifications to your application ensures accurate, repeatable bandwidth measurements and prevents wasted time or resources on misconfigured setups.
Step-by-Step Bandwidth Measurement Methodology
To trace bandwidth accurately, follow a structured workflow that includes preparation, measurement, and analysis. Each stage plays a critical role in ensuring reliable results, especially when working near performance limits or validating designs for compliance.
Start by isolating your system and calibrating your instruments. Then, capture the signal using appropriate test methods, whether in the time or frequency domain. Finally, analyze the data to extract meaningful bandwidth figures, such as the 3 dB cutoff point. For detailed signal quality considerations, see this guide on signal integrity.
Preparation Phase
Accurate bandwidth measurement starts with controlled test conditions. Before capturing any data, take the following steps:
- Isolate the system under test (SUT) by removing external signal paths and noise sources.
- Establish reference conditions, such as known input levels or termination values.
- Calibrate instruments using certified standards and traceable procedures.
- Ensure proper grounding and shielding to minimize EMI and prevent ground loops.
- Select test signals that match your bandwidth target. Impulse, step, or swept-frequency inputs often work best.
Skipping these steps introduces uncertainty and can skew your final bandwidth result. Preparation ensures the measurement reflects the system, not the setup.
Measurement Execution
Once your environment is ready, begin the acquisition process:
- Choose time-domain methods (like oscilloscope edge response) for fast rise-time systems, or frequency-domain methods (like swept-frequency analysis) for RF and analog systems.
- Use a swept-frequency technique to map amplitude over a defined range.
- Apply the impulse response method if you're analyzing filters or amplifiers.
- Consider single-tone vs. multi-tone excitation based on your target application.
- Monitor the noise floor, which can limit dynamic range and hide critical bandwidth details.
These choices impact accuracy, so align them with your signal characteristics and instrumentation limits.
Data Analysis and Interpretation
With signal data captured, move to post-processing:
- Locate the 3 dB cutoff frequency, where power drops to half of its peak value.
- Apply standard bandwidth formulas, depending on your measurement method and domain.
- Use normalization to remove scale or gain variation effects.
- Account for measurement uncertainty, especially if your readings fall near the instrument’s rated limits.
- Apply statistical validation techniques like averaging or confidence intervals to ensure repeatability.
For more on frequency-domain techniques, refer to Keysight’s guide to spectrum analysis.
Advanced Bandwidth Tracing Techniques
For engineers working with complex or noisy systems, standard bandwidth measurement methods may not go far enough.
Advanced techniques like S-parameter analysis, FFT-based methods, and noise-resilient setups provide higher accuracy and better insight, especially in RF, high-speed digital, and analog front-end applications.
Use these methods when you need to characterize system behavior over a broad frequency range, minimize noise impact, or validate designs under tight performance margins. Learn more about these advanced techniques in Keysight’s overviews of network analysis and digital signal processing.
Overcoming Limitations of Standard Approaches
- Use S-parameters for reflection and transmission behavior in high-frequency systems.
- Apply FFT techniques for fast, wideband analysis in both time and frequency domains.
- Incorporate noise averaging and lock-in detection to isolate weak signals.
- Implement digital filtering and windowing to reduce distortion and spectral leakage.
- Build custom test setups that improve repeatability in low-SNR environments.
Network Parameter Analysis
S-parameter analysis offers detailed insight into how signals propagate through a system, especially critical in RF, microwave, and high-speed interconnects. Key measurements include:
- S11 and S21 parameters, representing reflection and transmission, respectively. These allow engineers to see how much signal is lost or reflected at different frequencies.
- Transfer function characterization, which helps define the system’s frequency response across a wide range.
- Group delay analysis, important in understanding signal distortion over frequency due to phase delay.
- Phase response, which affects timing and synchronization in systems where signal alignment matters.
S-parameters also support de-embedding and fixture compensation, allowing you to isolate the device under test from test setup effects. These techniques are essential for accurate modeling, simulation validation, and compliance testing in advanced designs.
Digital Signal Processing Methods
Digital signal processing (DSP) enables bandwidth analysis with higher flexibility and post-processing control. Core DSP methods include:
- Fast Fourier Transform (FFT): Converts time-domain signals into frequency-domain data, useful for identifying cutoff points and analyzing spectral content.
- Window functions: Applying a window (e.g., Hanning, Blackman) minimizes spectral leakage but can affect resolution. Engineers must balance main lobe width with side lobe suppression.
- Digital filtering techniques: Low-pass, high-pass, and bandpass filters can isolate the desired signal band before calculating bandwidth.
- Spectral leakage mitigation: Carefully chosen sample sizes and windows reduce energy spread across frequencies, improving clarity in cutoff detection.
These methods are especially useful in mixed-signal designs, where analog signal bandwidth must be validated after digital conversion or processing.
Noise-Resilient Measurement
In low signal-to-noise environments or highly sensitive applications, noise-resilient techniques make accurate bandwidth measurement possible:
- Signal averaging: Repeating measurements and averaging results reduces random noise and enhances signal visibility.
- Lock-in amplifiers: These extract signals at a known reference frequency while rejecting unrelated noise, ideal for very weak or narrowband signals.
- Correlation-based measurements: Comparing test and reference signals statistically improves resolution and robustness, especially for identifying bandwidth limits.
- Low-noise setups: Shielded enclosures, high-quality cables, and low-noise preamps help prevent external interference and preserve measurement integrity.
Combining these methods allows for precise bandwidth characterization even in challenging test environments.
Common Challenges and Troubleshooting
Even with the right tools and setup, engineers often run into issues when tracing bandwidth, especially under time constraints or in noisy environments.
Problems can stem from instrument limitations, signal degradation, or interference. Understanding the source of error helps you correct it quickly and get accurate results.
Refer to Keysight’s attenuation guide to learn how signal loss impacts measurement reliability.
Measurement Accuracy Issues
Several equipment-related factors can distort bandwidth results:
- Instrument bandwidth limitations: If the scope or analyzer’s rated bandwidth is too low, it won’t capture the signal’s full frequency content.
- Probe loading effects: Passive probes with high capacitance can alter the signal and reduce measured bandwidth.
- Impedance mismatches: Mismatched source and load impedances lead to signal reflections and inaccurate frequency responses.
- Dynamic range constraints: Limited vertical resolution or noise floor issues can mask weaker signal components, skewing bandwidth data.
Choose instruments with bandwidth headroom and match probes and connectors to your signal path to avoid these issues.
Environmental Factors
External conditions can introduce variability into bandwidth measurements:
- Temperature effects: Fluctuations can impact instrument accuracy and signal path characteristics.
- EMI/RFI interference: Nearby sources of radio frequency noise can overlay unwanted signals. Learn more about RF interference.
- Ground loop elimination: Improper grounding can introduce 50/60 Hz noise and harmonics, distorting readings.
- Power supply noise isolation: Ripple or switching transients can leak into sensitive measurements and corrupt results.
Stabilizing lab conditions and using shielded cables or enclosures can mitigate most environmental factors.
Signal Integrity Problems
Poor signal quality leads to bandwidth estimation errors. Look out for:
- Reflections and standing waves, often caused by impedance mismatches or long, unterminated cables.
- Crosstalk, especially in multi-channel systems or high-speed digital lines.
- Cable losses, which increase with frequency and length, attenuating signal content.
- Harmonic distortion, which creates frequency components not present in the original signal, skewing FFT or frequency-domain measurements.
Signal conditioning and high-quality interconnects can help preserve true signal shape.
Bandwidth Measurement Troubleshooting Matrix
| Symptom | Likely Cause | Suggested Fix |
|---|---|---|
| Unexpected low bandwidth reading | Instrument BW too low | Use higher-rated scope or analyzer |
| Signal shape looks distorted | Probe loading or cable reflection | Use active probes, check cable termination |
| Noisy frequency response | EMI or grounding issue | Shield test area, eliminate ground loops |
| Inconsistent results | Temperature drift or calibration | Warm up equipment, recalibrate |
| Missing signal peaks | Limited dynamic range or SNR | Use averaging, improve noise floor |
Use this matrix to quickly pinpoint and resolve common issues that can compromise bandwidth measurements, saving time and improving test accuracy.
Case Studies: Practical Bandwidth Tracing Examples
Bandwidth tracing plays a critical role in real-world engineering tasks across RF, digital, and power domains.
The examples below demonstrate how engineers approach bandwidth measurements in practical settings. Each case covers the test setup, method, results, and challenges resolved, so you can apply similar strategies in your own lab.
RF Circuit Bandwidth Characterization
An RF design team tested a 2.4 GHz wireless transceiver module to confirm its bandwidth met regulatory and performance requirements. They used a spectrum analyzer with ≥3 GHz bandwidth and a calibrated signal generator to sweep across the operating range.
The measurement process involved:
- Injecting a modulated test signal into the circuit
- Capturing the output using a directional coupler
- Measuring the 3 dB cutoff points of the transmitted signal
They observed unexpected roll-off at 2.2 GHz, traced to a poorly matched PCB trace and connector interface. By improving impedance matching and re-running the test, they confirmed the full 2.4–2.5 GHz bandwidth.
Outcome: Verified compliance with modulation bandwidth requirements, while correcting design layout issues.
High-Speed Digital Interface Analysis
To validate a high-speed USB 3.2 interface, engineers used a high-bandwidth oscilloscope (≥4 GHz) and time-domain reflectometry tools. They focused on eye diagram clarity and bandwidth consistency across the channel.
Their steps included:
- Capturing eye diagrams at multiple points along the signal path
- Analyzing rise times and jitter
- Calculating effective bandwidth based on the 0.35/tr rule
The team identified excess jitter and a closed eye due to connector reflections. They redesigned the via structure and shortened trace lengths, which improved the eye opening and restored expected bandwidth performance.
Outcome: Achieved a cleaner eye and met signal integrity standards for USB compliance testing.
Power Electronics Bandwidth Evaluation
A power electronics lab tested the bandwidth of a digital control loop in a high-frequency DC-DC converter. The goal was to confirm that the loop gain rolled off as expected, ensuring stability across load conditions.
Using a network analyzer and frequency injection technique, they:
- Applied a swept sine wave at the control input
- Measured the output response across the bandwidth range
- Calculated the gain and phase margin
Initial measurements showed phase instability around 80 kHz. Further analysis revealed parasitic inductance in the feedback path. After layout adjustments and retesting, the gain-phase curve showed proper roll-off with a 20 kHz bandwidth and 60° phase margin.
Outcome: Verified stable control loop operation and optimized converter performance through improved PCB design.
Bandwidth Tracing in Specific Applications
Bandwidth measurement plays a critical role in ensuring system performance and compliance across industries.
Whether you're testing communication channels, validating control system stability, or fine-tuning audio fidelity, accurate bandwidth tracing helps you make informed design and troubleshooting decisions.
The following examples show how bandwidth applies in telecom, control, and audio applications, along with the tools and techniques best suited to each environment.
Telecommunications Systems
In telecom, bandwidth directly influences channel capacity, signal clarity, and regulatory compliance. Engineers often use spectrum analyzers and return loss measurements to characterize system behavior. For example, when verifying a 5G transceiver, you might:
- Measure modulation bandwidth to ensure support for high-speed data formats.
- Optimize signal-to-noise ratio (SNR) for better throughput and receiver sensitivity.
- Use a spectrum analyzer to evaluate return loss and channel reflections.
- Confirm regulatory compliance by tracing occupied bandwidth and spurious emissions.
Outcome: Bandwidth tracing ensures high-capacity communication and adherence to spectrum regulations.
Control Systems
In control systems, such as servo loops or motor drives, bandwidth defines how fast the system responds to changes without becoming unstable. Engineers typically measure:
- Closed-loop bandwidth, which indicates the frequency range over which the system tracks a reference signal.
- Open-loop response, captured using frequency response analysis tools like network analyzers.
- Gain and phase margins, which are derived from the Bode plot to evaluate system robustness.
By tracing control loop bandwidth, you can verify the system reacts fast enough for real-time control but not so fast that it amplifies noise or becomes unstable.
Outcome: Accurate bandwidth measurement supports safe, efficient, and responsive control behavior.
Audio and Instrumentation
In audio engineering and instrumentation, bandwidth affects how accurately a system captures or reproduces signals. Common tasks include:
- Measuring frequency response of amplifiers or equalizers to confirm fidelity across the audible range (20 Hz–20 kHz).
- Characterizing sensor bandwidth, especially for pressure, vibration, or acoustic transducers.
- Validating data acquisition system specs to ensure accurate sampling without aliasing.
- Evaluating how bandwidth limitations distort signal shapes or reduce resolution.
Tools used here often include audio analyzers, FFT software, and high-resolution oscilloscopes. Engineers may also simulate response curves to predict real-world behavior before hardware testing.
Outcome: Bandwidth tracing ensures clarity, precision, and consistency in signal-sensitive applications.
Documentation and Reporting Best Practices
Thorough documentation is critical for verifying bandwidth measurements, supporting design reviews, and meeting compliance standards. Poorly reported data can lead to misinterpretations, failed audits, or repeated testing.
Use the following best practices to ensure your bandwidth reports are complete, clear, and usable across engineering teams and stakeholders.
- Document Essential Parameters
Always include:- Instrument model, firmware version, and calibration status
- Test setup details (cables, probes, fixtures)
- Input signal type and configuration
- Measured 3 dB cutoff frequency or bandwidth range
- Test environment conditions (e.g., temperature, shielding)
- Report Measurement Uncertainty
Quantify how confident you are in the results. Include:- Sources of error (instrument tolerance, signal noise, environmental drift)
- Confidence intervals or standard deviation
- Statement of overall uncertainty (e.g., ±1.2 MHz @ 95% confidence)
- Use Standardized Graphical Representations
Visuals improve clarity, especially for bandwidth comparisons:- Use labeled frequency plots with grid lines and markers at cutoff points
- Show multiple runs or averaged traces where relevant
- Indicate measurement bandwidth or resolution bandwidth (RBW)
- Format Data for Multiple Audiences
Tailor your reporting format depending on your reader:- Engineers: detailed tables, raw data, instrument settings
- Managers or clients: summarized plots, annotated results, key conclusions
- Compliance bodies: formatted reports aligned with required test procedures
- Include Compliance Documentation Requirements
If the data supports certification, include:- Test standards or protocols followed (e.g., FCC, CISPR, MIL-STD)
- Reference to applicable limits or specifications
- Supporting screenshots, plots, and signed test results
- Track Version Control for Test Procedures
Use a consistent method to version test scripts and procedures:- Assign version numbers and revision dates
- Log changes in setup, script updates, or analysis method changes
- Archive old versions for traceability and audit readiness
Clear, consistent documentation supports engineering accuracy and speeds up communication, troubleshooting, and regulatory approvals.
Automation of Bandwidth Tracing Procedures
Automating bandwidth measurements improves consistency, reduces human error, and accelerates data collection, especially in high-throughput environments. Engineers should structure their automation processes to include the following:
- Clearly defined test parameters and metadata
- Consistent data formatting (CSV, XML, or JSON) for repeatable parsing
- Embedded uncertainty values with each result
- Compliance checklists for required test limits, standards, and documentation
- Versioning of scripts and calibration routines
Automation should also log timestamps, instrument states, and operator notes to ensure full traceability.
Test Script Development
Reliable automation starts with well-structured test scripts. Engineers should:
- Use languages like Python, SCPI, or LabVIEW to interface with instruments.
- Leverage each tool’s command interface (e.g., VISA, LXI, or USB) to send/receive test commands.
- Build in error handling to catch timeouts, connection losses, or invalid results.
- Structure scripts into modular sequences (e.g., initialize → calibrate → measure → log) for better debugging and reuse.
- Comment and version scripts to enable updates and team collaboration.
Reusable, well-documented scripts reduce ramp-up time and support scalable testing.
Data Collection and Processing
Automation helps manage large datasets and extract usable metrics. Key practices include:
- Using real-time acquisition to stream data directly from instruments.
- Applying automated analysis algorithms to identify 3 dB points, calculate margins, or compare against benchmarks.
- Implementing statistical process control (SPC) to monitor performance trends over time.
- Validating results with programmed sanity checks, such as expected ranges or signal quality thresholds.
These steps ensure clean, high-confidence results with minimal manual review.
Integrated Test Systems
An effective test environment combines both hardware and software integration:
- Choose hardware with synchronized clocks and shared triggers for consistent timing
- Design software architecture to support plug-and-play instruments and scalable modules
- Include automated calibration routines tied to test initiation
- Run system verification checks to confirm that all test components operate as expected before measurement begins
Integrated systems reduce variability and create a stable foundation for long-term measurement accuracy.
Future Trends in Bandwidth Measurement Technology
As bandwidth demands increase across industries, from 5G and satellite communications to high-speed computing and power electronics, test technologies are evolving to keep pace.
Engineers can expect major shifts in how bandwidth is measured, reported, and interpreted. These changes aim to improve accuracy, speed, and integration across workflows, while also making test equipment more accessible and adaptable.
Here are some of the most significant trends shaping the future of bandwidth measurement
- Emerging Measurement Methodologies: Techniques like real-time de-embedding, multi-tone excitation, and wideband time-domain reflectometry allow faster, more accurate bandwidth characterization. This is especially useful in systems with complex signal paths or interconnects.
- AI and Machine Learning Applications: Machine learning is being used to identify signal anomalies, optimize measurement parameters in real time, and reduce noise without manual filtering. These models can improve cutoff detection and signal classification with minimal human input.
- Cloud-Based Collaborative Testing: Test data can now be streamed and analyzed remotely using secure cloud environments. Teams in different locations can access shared measurement setups, validate bandwidth results, and collaborate on debugging or compliance.
- Improvements in Measurement Accuracy: Higher-resolution digitizers, improved timebase stability, and advanced calibration techniques are pushing the limits of bandwidth precision. Better accuracy reduces measurement uncertainty and enables tighter design tolerances.
- Miniaturization of Test Equipment: Portable spectrum analyzers, USB oscilloscopes, and compact vector network analyzers are making high-performance bandwidth testing more accessible in the field, on the production floor, or within space-constrained R&D labs.
- Software-Defined Instrumentation: Test platforms are increasingly software-driven, allowing users to reconfigure functions, like switching between scope, spectrum, and FFT modes, without changing hardware. This flexibility speeds up workflows and reduces equipment overhead.
- Integration with Digital Twins and Simulation: Engineers can now simulate signal behavior and compare it directly with measured data, using digital twin models. This integration shortens design cycles and improves predictive accuracy for bandwidth-limited systems.
We Help Engineers Meet Their Deadlines – Browse Our Offers
Conclusion
Tracing bandwidth accurately is essential for ensuring signal integrity, system performance, and design compliance. From selecting the right tools to applying advanced analysis techniques, each step plays a role in delivering reliable results.
If you are looking to upgrade your lab without stretching your budget, explore Keysight’s Premium Used Equipment. You will get certified, pre-calibrated instruments backed by warranty—ready to perform when precision matters most.
Whenever You’re Ready, Here Are
5 Ways We Can Help You
1
2
Call tech support US: +1 800 829-4444
Press #, then 2. Hours: 7am – 5pm MT, Mon– Fri
3
Contact our sales support team
4
Create an account to get price alerts and access to exclusive waitlists
5
Talk to your account manager about your specific needs