
NB-IoT Modulation Analysis 89600 VSA Software Option 89601BHTC
Technical Overviews
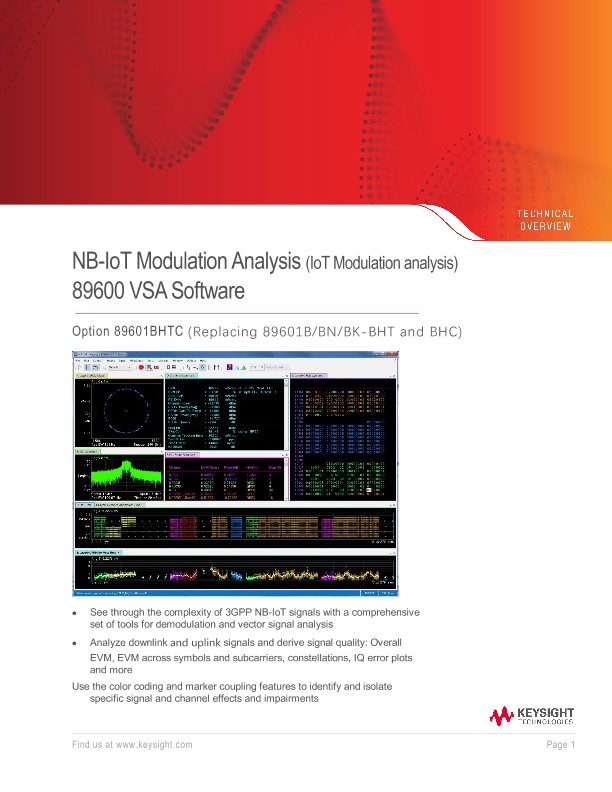
• See through the complexity of 3GPP NB-IoT signals with a comprehensive set of tools for demodulation and vector signal analysis
• Analyze downlink and uplink signals and derive signal quality: Overall EVM, EVM across symbols and subcarriers, constellations, IQ error plots and more
Use the color coding and marker coupling features to identify and isolate specific signal and channel effects and impairments.
3GPP NB-IoT Air Interface
Although NB-IoT is incompatible with existing 3GPP devices, it inherits many LTE characteristics, such as the physical layer foundation and the higher layer architecture. The only duplex mode that has been standardized is Frequency Division Duplex (FDD); therefore, uplink and downlink use different frequencies. To reduce device complexity and cost, three major design decisions have been made. First, NB-IoT follows a half-duplex design so there is no need for expensive duplexer filters to isolate the transmit and receive chains; you can use a switch instead. Second, spatial multiplexing MIMO is not supported, and therefore UE is only required to implement one receiver chain. Finally, and very importantly, the channel bandwidth is only 180 kHz, which reduces the overall platform cost.
NB-IoT Modulation Analysis
The 89600 VSA software’s Option 89601BHTC provides comprehensive analysis capabilities in the frequency, time, and modulation domains for signals based on 3GPP specification (www.3gpp.org) The software provides frequency-, time-, and modulation-domain analysis results in a single measurement. By configuring result traces of spectrum, acquisition time, and NB-IoT specific modulation quality traces and tables, engineers can identify overall signal characteristics and troubleshoot intermittent error peaks or repeated synchronization failures. For automated testing, .NET API and SCPI remote interfaces are available to accelerate design, which enables quicker transition to the design verification and manufacturing phases. NB-IoT is among over 75 signal standards and modulation types supported by the 89600 VSA software. The software is a comprehensive set of tools for demodulation and vector signal analysis. These tools enable you to explore virtually every facet of a signal and optimize even the most advanced designs. As you assess your design tradeoffs, the 89600 VSA helps you cut through the complexity.
Perform NB-IoT transmitter measurements
Option 89601BHTC supports NB-IoT modulation analysis measurements according to 3GPP TS36 specification. Supported features include:
• All deployment modes: standalone, guard-band and in-band (same or different PCI)
• Downlink (DL) and Uplink (UL) channels and signals with corresponding modulation format
o DL channels and signals: NPSS, NSSS, NRS, NPRS, NPBCH, NPDSCH, NPDCCH
o UL channels and signals: NPUSCH, NPUSCH-DMRS, NPRACH
• Auto detection of NPDSCH and NPUSCH allocations
• Decoding for NPBCH, NPDSCH and NPUSCH
• DL N-TM signal auto configuration and auto detection
• DL MIMO configuration: 1, 2 transmit antennas for Tx diversity using single input channel
Understand the structure and quality of NB-IoT signal
Use the powerful demodulation and analysis tools to understand the structure and quality of the transmitted NB-IoT signal. A user has complete flexibility to choose the trace format and number of simultaneous traces. Figure 4 shows an example of an in-band downlink NB-IoT signal that is deployed within a 10 MHz LTE carrier. Each of the seven traces show an orthogonal view of the signal, and many more views are possible depending on the purpose of the analysis.
Descriptions of some of the digital demodulation traces
• Trace A (top left) shows a composite IQ constellation of the demodulated signal containing QPSK allocated to NPDSCH, NRS, NPDCCH, NPBCH and Zadoff-chu sequence for NPSS and NSSS.
• Trace B (top right), shows a color-coded view of the transmitted signal structure. This two[1]dimensional grid with frequency (subcarriers) on the vertical axis and time (symbols) on the horizontal axis shows the transmitted signal in this example NPBCH followed by NPDCCH, NPDSCH, NPSS, NPDSCH and NSSS.
• Trace C (center), shows frame summary table, which is the key to the color coding and the modulation format used by each channel/signal. This table lists all the transmitted physical signals and channels. For each entry, there is an assigned color, and four measurement results are displayed: EVM, channel power, modulation format and number of allocated RB.
• Trace D (top middle) is the error summary providing quality statistics for the composite signal including EVM, frequency error, symbol clock error, IQ impairments plus more.
• Traces E (bottom center) and F (bottom right) show EVM as a function of subcarrier and OFDM symbols respectively.