Automated Frequency Response Analysis (Bode Plots) with the InfiniiVision 1000 X-Series Oscilloscope
Show Description
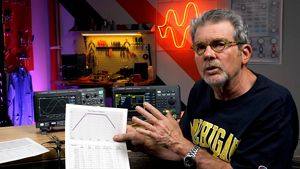
Engineers have traditionally used an oscilloscope and an external function generator to manually perform multiple amplitude and phase measurements at a range of frequencies to produce a frequency response plot to compare to a straight-line Bode plot approximation based on poles and zeros. This video shows how to perform gain and phase measurements on a L-C-R bandpass filter using the traditional method, as well how to perform the same measurement automatically using a scope with a built-in waveform generator and automatic frequency response analysis (Bode plots).