Understanding Noise Figure
데모
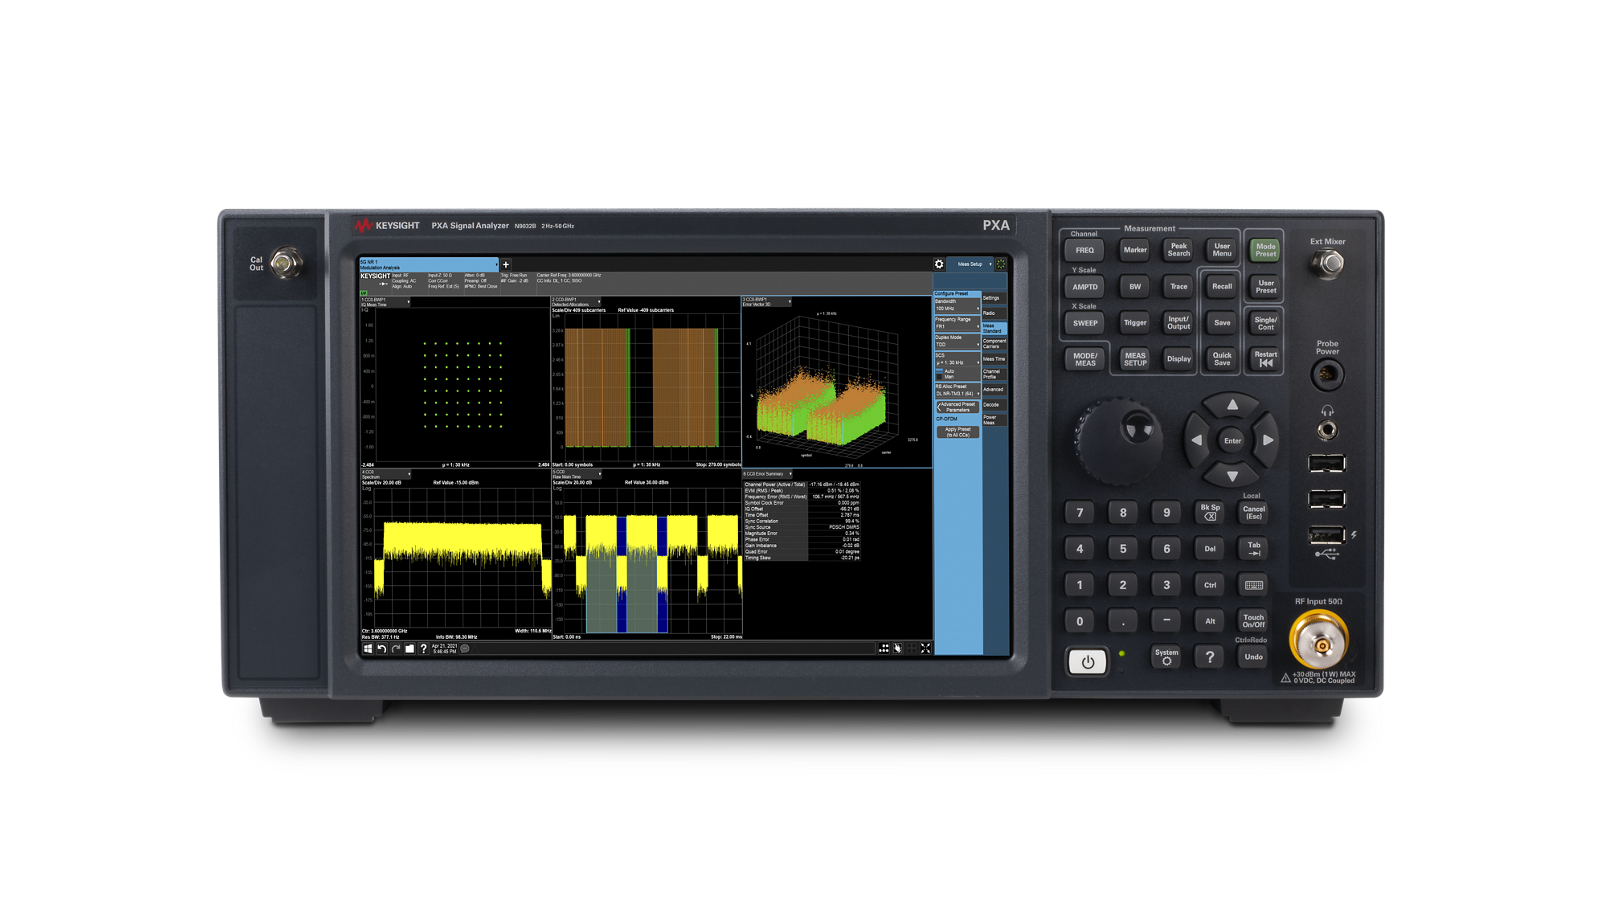
Noise figure is the most commonly used figure of merit for RF systems and components. This video explains what noise figure is, why it matters, how it cascades through a signal chain, and how to measure it with the Y-factor method, which modern signal analyzers such as the Keysight X-Series automate.
What is noise figure?
Noise figure describes the increase in noise as a signal passes through each part of a signal chain. When an input signal feeds an amplifier, the signal amplitude at the output increases because of the amplifier's gain, and the noise is amplified by the same amount. The amplifier also adds its own noise. Signal-to-noise ratio (SNR) is the ratio of signal power to noise power, normally expressed in decibels (dB). Noise occurs in all electrical components, passive and active, so every component a signal passes through decreases SNR. The challenge for designers is to minimize this degradation.
Noise figure lets you characterize the noise contribution of one part, the noise of a whole system, and the noise of larger systems built from other systems. It is cascadable. It applies to individual components such as resistors or capacitors, subsystems such as filters, complete devices such as radio receivers, and larger solutions with multiple devices. Each has its own noise figure, and because noise figure is expressed in dB, you can add parts together to get the noise figure of their combination.
Why do we care about noise?
Noise causes system impairments that limit your ability to detect and resolve signals. Sensitivity, the smallest signal an RF system can receive, depends heavily on noise, because noise reduces SNR and lowers the probability that a small signal can be resolved. In extreme cases, the wanted signal is buried in the noise floor and can no longer be resolved. This is especially problematic in radar applications. Noise also reduces a digital system's accuracy and its ability to resolve symbol locations, which reduces channel capacity and affects bit error rate.
How can you improve signal-to-noise ratio?
You can increase transmit power with a more powerful amplifier, but that makes the device less efficient and increases cooling requirements and running costs. You can increase antenna gain, but that is inefficient because most of the transmitted power does not reach the intended receiver. You can reduce path loss, but that is unlikely to be feasible, because the whole point of radio is to provide communications between remote locations. The easiest option is to lower the receiver noise.
Noise figure and noise factor
Noise figure is a logarithmic measurement expressed in dB. Its linear equivalent is noise factor (F), the linear ratio of the input signal-to-noise ratio to the output signal-to-noise ratio. Noise figure (NF) is noise factor expressed in dB: take the log of the noise factor and multiply by 10.
Cascaded noise figure
When components are cascaded, their noise figures add, but placement matters. In a chain of amplifiers, the first amplifier contributes its noise factor, F1. The second contributes F2 minus 1, divided by the gain of the first amplifier (G1). The third contributes F3 minus 1, divided by the product of all previous stage gains. This calculation is done linearly, so you use noise factor and convert the result to dB. Each added stage contributes less because the gains in the denominator keep growing, which makes the first stage dominant in the overall noise figure. To achieve the lowest possible noise figure, place the components with the lowest noise and highest gain as close to the start of the chain as possible.
Measure noise figure with the Y-factor method
Several methods can measure noise figure, but the Y-factor method is the most commonly used. You can do it manually, and modern signal analyzers such as the Keysight X-Series automate it. The method is sometimes called the hot-cold source method. A noise source feeds a known noise level, the excess noise ratio (ENR), into the device under test (DUT). The noise source manufacturer supplies the ENR values. They used to be a written table that you entered by hand, but they are now usually stored electronically on the noise source and copied automatically into the signal analyzer.
Next, the analyzer measures the noise power at the DUT output. The ratio of the noise power with the noise source on to the noise power with it off is the Y factor. With ENR and Y known, you can calculate the noise figure. The Y-factor method also lets you calculate the gain of the DUT.
The method needs four measurements: the DUT input and the DUT output, each with the noise source on and off. A modern analyzer automates this, so you connect only one calibration setup and one measurement setup. It measures the noise at the DUT input and output in the cold state, with the noise source off. Then the noise source turns on, which is the hot state, and the analyzer measures the power at the DUT input and output. To find the noise the DUT adds, observe where the line joining the two points meets the y-axis. The slope of the line gives the gain of the DUT.
What you will learn
- What noise figure and noise factor are, and why noise figure is cascadable
- Why noise limits sensitivity, accuracy, and channel capacity
- Ways to improve SNR, and why lowering receiver noise is the easiest option
- How cascaded noise figure works and why the first stage dominates
- How the Y-factor method measures noise figure and gain with a noise source and ENR