Wi-Fi 7 Troubleshooting with a Wireless Analyzer
데모
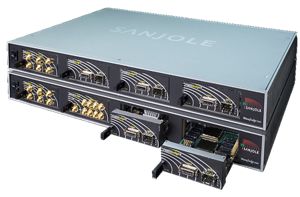
Troubleshooting Wi-Fi 7 requires understanding both the transmitted signal and the messages exchanged between an access point and its clients. This demonstration shows how the Keysight Wireless Analyzer (WaveJudge) connects protocol decoding with radio frequency (RF) analysis. Follow a captured transmission from an error indication through subcarrier measurements, constellation plots, and detailed message data.
The setup uses a Keysight analyzer with Wireless LAN Test (WLT) application software to simulate 25 clients communicating with an access point. The wireless analyzer passively captures the traffic, providing a view of the exchange for investigation.
Capture and decode Wi-Fi 7 traffic:
The presenter configures the WaveJudge hardware’s RF ports and selects Wi-Fi 7 for the capture. The demonstration records a short interval of traffic and stores the captured data on the hardware’s solid-state storage.
WaveJudge decodes the capture and displays lower- and upper-layer messages alongside RF charts derived from the in-phase and quadrature (IQ) data. The message list includes information such as the client’s station identifier, multiple-input multiple-output (MIMO) layer, and modulation and coding scheme (MCS).
The demonstrated traffic uses MCS 13 with 4096-state quadrature amplitude modulation (4096-QAM). These details establish the context for examining the modulation performance and decoding behavior of individual transmissions.
Connect protocol messages with RF measurements:
WaveJudge correlates each chart with the selected message in the message list. Selecting a transmission lets you inspect its RF characteristics alongside its decoded content.
The demo introduces several views for investigating signal behavior:
- The constellation chart displays individual modulation points and supports separate views of MIMO layers.
- The 2D power chart shows subcarrier power and type across time and frequency.
- The time-domain power chart displays instantaneous and average power, with noise floor and full-scale references.
- The spectral power chart shows subcarrier power versus frequency.
- The error vector magnitude (EVM) per subcarrier chart displays average and peak measurements to help identify outliers.
A summary view also presents information such as frequency, bandwidth, EVM, and throughput for access points and clients. The presenter demonstrates how these related views provide different perspectives on the same captured traffic.
Investigate a subcarrier with unexpected EVM:
Automatic error checking identifies messages that warrant closer investigation. In the example, the presenter examines an EVM per subcarrier plot and finds one subcarrier with substantially different performance from the others.
Subcarrier −447 has a reported peak EVM of approximately −26 dB. The presenter then opens the associated constellation chart, where the subcarrier’s point lies outside the expected 4096-QAM constellation range.
This observation provides a possible explanation to investigate alongside the message error. The demonstration does not establish that the subcarrier behavior alone caused the decoding failure. Instead, it shows how correlated measurements help you gather evidence about the affected transmission.
Inspect decoding details and message data:
The next step opens detailed parameters for the selected message. This view displays decoded information and identifies areas where errors were detected.
In the demonstrated transmission, codeword index 2 does not decode after 15 iterations, while other codewords decode after three or four iterations. The presenter notes that increasing the maximum iteration count might allow decoding, then continues investigating the message content.
The bit and hexadecimal views expose the captured message data. WaveJudge highlights the protected-data area associated with the cyclic redundancy check (CRC) error, giving the presenter another level of detail to examine.
Follow a connected troubleshooting workflow:
The demonstration moves from a network traffic capture to a specific message, then to its subcarrier behavior and decoding details. That sequence shows how protocol and RF analysis can work together when investigating Wi-Fi 7 transmission errors.
Watch the demo to learn how to navigate the message list, compare correlated charts, and inspect the data behind an error indication. The workflow provides a practical example of investigating Wi-Fi 7 traffic across multiple simulated clients.