


Title
Loop bandwidth (response speed)
Tech Guide
Bode Plot Oscilloscope Guide: Measure Frequency Response Without a Network Analyzer

Introduction
Your DC-DC converter works on the bench. The load steps look mostly clean. But the design review wants measured gain and phase margins, the analyzer request died in the last budget round, and the deadline is not moving. That mix of time pressure, budget pressure, and doubt is where most engineers meet this question: can the oscilloscope you already trust produce a stability measurement you can stand behind?
It can, if the oscilloscope has the right function. This guide shows you how a scope-based frequency response analyzer (FRA) works, how to wire and run the sweep, and how to read gain and phase margins. It also explains why ADC resolution affects what you can measure, which Keysight models fit the job, and what the capability costs to own. The reference instrument throughout is the Keysight InfiniiVision HD3 (HD304MSO), available certified used directly from the OEM.
Summary
- A Bode plot graphs gain in dB and phase in degrees against a logarithmic frequency axis. It's how you read filter corners, amplifier response, and control loop stability margins.
- An oscilloscope with an FRA function measures it directly: the generator sweeps the stimulus, 2 channels capture input and output, and the scope plots gain as 20·log10(Vout/Vin) plus phase at every frequency point.
- The Keysight InfiniiVision HD3 (HD304MSO) integrates the frequency response analyzer with a 100 MHz WaveGen (the HD3WAVEGEN license option) on a 14-bit, 3.2 GSa/s platform: 200 MHz to 1 GHz bandwidth options, 20 to 100 Mpts memory, 4 analog plus 16 digital channels. HD300PWRA software automates control loop response and PSRR.
- Certified used instruments can save 40 to 90% versus new, with up to 5 years of warranty options and a 101-point quality checklist on Keysight Premium Used units.
What Is a Bode Plot?
A Bode plot is a pair of graphs that describe a circuit's frequency response: gain in decibels and phase in degrees, both plotted against a logarithmic frequency axis. Read together, the magnitude and phase traces show how a filter, amplifier, or feedback loop responds across its working range, and how close a control loop is to instability.
The logarithmic axis makes the plot useful. Frequency advances logarithmically, so decades compress into one view, response slopes become straight lines (20 dB per decade for a single pole), and corner frequencies appear where the gain trace and phase plot bend. On a linear axis, the same data would be much harder to read.
The technique takes its name from Hendrik W. Bode of Bell Telephone Laboratories, whose 1940 Bell System Technical Journal paper on attenuation and phase in feedback amplifier design (vol. 19, pp. 421-454) introduced the log-frequency gain and phase plots engineers still use.
In day-to-day work you can pull 3 answers from a Bode plot: the -3 dB corner of a low-pass filter, the flatness and roll-off of an amplifier stage, and the gain and phase margins of a switch-mode power supply's control loop. High-pass and band-pass corners read the same way, with the expected shape changes. The frequency response of a circuit is its fingerprint, and the Bode plot is how you capture it.
Can an Oscilloscope Measure a Bode Plot?
Yes. Modern digital oscilloscopes with an FRA function and a signal source measure calibrated Bode plots: the generator output steps a sine stimulus through a list of test frequencies, 2 channels capture the input signal and the DUT output, and the scope computes gain as 20·log10(Vout/Vin) plus the phase shift at each point.
For many bench jobs, that can replace a dedicated frequency response analyzer when you need to characterize the frequency response of a filter, loop, or supply rail at baseband. Keysight explains this use case in its application note (What Is Frequency Response Analysis, 5992-4010). The boundary is important: a scope-based FRA does not replace a vector network analyzer for RF S-parameter work. It's the right tool below roughly the 10s of MHz where power supplies, audio chains, and analog filters operate.
The measurement approach isn't new either. R. D. Middlebrook of Caltech published the closed-loop injection method in 1975, showing loop gain can be measured by injecting a small signal into the feedback path without opening the loop. A scope-based FRA automates exactly that measurement.
On the InfiniiVision HD3 series, the frequency response analyzer is one of the integrated instruments, alongside the scope itself, a 100 MHz WaveGen, a protocol analyzer, a digital voltmeter, and a frequency counter. There's no external generator to pair and no brand-compatibility issue: the stimulus source and the analyzer live in one box.
One more advantage over a black-box analyzer: the scope shows the actual VIN and VOUT waveforms while the sweep runs. If the stimulus overdrives the circuit into distortion, you see it in the time domain immediately, the same way an FFT exposes spectral surprises.
What Do You Need for a Scope-Based Bode Plot?
An automated Bode sweep needs an FRA function, a generator, and 2 analog channels. In checklist form:
- An oscilloscope with a frequency response analysis function (menus list it as FRA, a Bode plot function, or frequency response measurements)
- A signal source: a built-in WaveGen, or an external function generator the scope can control
- 2 analog channels, one on the circuit's input, one on its output
- Probes matched to the impedances involved, with correct termination, such as 50 ohms where the signal path expects it
- For control loop and PSRR work: an injection transformer or line injector, plus a small injection resistor in the feedback path
- For active circuits: a DC block so the stimulus does not push an op-amp stage into saturation
On the HD304MSO, the generator is integrated: the 100 MHz WaveGen is available through the HD3WAVEGEN license option rather than as a separate instrument, and the FRA drives it directly. Check that the license is enabled on the specific unit. On older used InfiniiVision 3000T and 4000 X-Series scopes, FRA was available as a license (DSOXT3FRA or DSOX4FRA) on top of the WaveGen option. Confirm the installed options on the listing before you buy, and ask our team to verify a specific unit's configuration if the listing is unclear. If you'd rather pair an external source, the signal generator buying guide covers the used options.
This checklist helps prevent a common mistake: buying a two-channel scope without the FRA function or generator and discovering it after unboxing. Community forums show how often this happens. Count the channels, confirm the function, and confirm the source.
For loop and PSRR measurements, the HD300PWRA power analysis package automates the sweep, injection settings, and readout on the HD3. The injection transformer is the main extra piece of hardware to plan for.
Compare current MSOX3054G / MSOX3104G availability
How Do You Run a Frequency Response Sweep?
Here's the bench procedure for an engineer running this measurement for the first time on an FRA-equipped InfiniiVision scope:
- Connect the stimulus. Route the WaveGen output to the circuit's input through the appropriate coupling, and connect channel 1 directly to the stimulus or input node.
- Connect the response. Connect the DUT output to channel 2, and match probe attenuation and termination to the impedances involved.
- Set the sweep range. Start a decade or 2 below the expected corner or crossover, stop a decade above. For a supply loop expected to cross near 50 kHz, sweeping 100 Hz to 1 MHz gives context on both sides.
- Configure the sweep density. 10 points per decade is the practical default; add data points around corners and suspected resonances.
- Profile the stimulus amplitude. Use a larger amplitude at low frequency, where the loop attenuates the disturbance heavily, and reduce it at higher frequencies near crossover, where the loop is more sensitive. One fixed amplitude can bury the readings in noise or overdrive the circuit.
- Run the sweep and export. Watch the live VIN/VOUT waveforms while it runs, then export the gain and phase data for the design record.
The amplitude-profiling step is the one that separates a clean plot from a misleading one. Keysight's control-loop measurement note (5992-0593) follows the same discipline: use a stimulus large enough to clear the noise floor, small enough to keep the loop linear, and adjusted by frequency band rather than fixed across the whole sweep.
Sweep density matters more than it may seem. A resonant peak 1/20 of a decade wide simply doesn't exist on a 5-points-per-decade sweep. If a filter or loop can ring, give the sweep the resolution to show it.
If you're newer to bench measurement, the how to use an oscilloscope guide covers the probing and triggering fundamentals this procedure assumes.
How Do You Read Gain and Phase Margin?
Two numbers tell you whether a control loop has enough stability headroom. Phase margin is 180 degrees minus the measured phase lag at the gain-crossover frequency, the point where the gain trace crosses 0 dB. Gain margin is how far the gain is below 0 dB at the frequency where phase lag reaches 180 degrees.
Take a worked example. A buck converter switches at 500 kHz, and you target loop crossover near 50 kHz (fSW/10). The sweep shows gain crossing 0 dB at 48 kHz, with 52 degrees of phase margin and 9 dB of gain margin at the phase crossover, read directly with the measurement cursors. That loop is stable, with useful but not generous headroom. It may be worth a compensation tweak toward 60 degrees before layout freeze. The same basic reading applies across control systems work, from power supplies to servo loops.
| Plot feature | What it tells you | Healthy target |
|---|---|---|
| Gain-crossover frequency | Loop bandwidth (response speed) | Commonly fSW/20 to fSW/10 |
| Phase margin | Damping and stability headroom | Above 45 degrees, 60 degrees is a common target |
| Gain margin | Tolerance to gain shifts over load and temperature | 6 to 10 dB or more |
| -3 dB corner | Filter or amplifier bandwidth | Matches the design intent |
Plot feature
What it tells you
Healthy target
Gain-crossover frequency
Title
Commonly fSW/20 to fSW/10
Commonly fSW/20 to fSW/10
Phase margin
Title
Damping and stability headroom
Damping and stability headroom
Title
Above 45 degrees, 60 degrees is a common target
Above 45 degrees, 60 degrees is a common target
Gain margin
Title
Tolerance to gain shifts over load and temperature
Tolerance to gain shifts over load and temperature
Title
6 to 10 dB or more
6 to 10 dB or more
-3 dB corner
Title
Filter or amplifier bandwidth
Filter or amplifier bandwidth
Title
Matches the design intent
Matches the design intent
Where do those targets come from? Analog Devices' power-supply design guidance (Henry Zhang, loop stability part 3) puts the working rule at phase margin greater than 45 degrees, with more than 60 degrees recommended. Christophe Basso's Electronic Design analysis adds a useful detail: critically damped transient response may require about 76 degrees of phase margin.
Use the time domain as your cross-check. A loop with 30 degrees of margin may ring visibly on a load step, while a 60-degree loop usually settles more cleanly. If the Bode plot and the load-step behavior disagree, check the measurement setup before you question the math.
For filters, read the -3 dB corner against spec, check stopband depth, and look for peaking near resonance. The resonance frequency formula tells you where to look, and the resolution section below explains why stopband depth depends on measurement floor.
Why Does ADC Resolution Matter for Bode Plots?
A Bode plot only looks useful if the scope can measure both the large signal and the small response riding below it. A Bode sweep's usable dynamic range is bounded by the scope's ADC resolution and noise floor: a deep filter stopband at 70 dB down, or a regulator PSRR of 60 dB, can produce output signals a low-resolution front end reads as noise. That is a measurement-resolution limit, not a circuit property.
The math is standard. An ideal converter's quantization-limited SNR follows SNR = 6.02·N + 1.76 dB (Analog Devices MT-001, Walt Kester): about 49.9 dB for 8 bits and 86.0 dB for 14 bits. For real instruments, the more useful spec is effective number of bits (ENOB), which IEEE Std 1057-2017 defines and tests for digitizing waveform recorders, because front-end noise uses part of the theoretical resolution budget.
| ADC resolution | Levels | What a Bode sweep can typically resolve |
|---|---|---|
| 8-bit | 256 | Moderate attenuation before readings reach the noise floor |
| 10-bit | 1,024 | Deeper stopbands, cleaner passband detail |
| 14-bit | 16,384 | Deep stopbands, high PSRR values, small gain variations |
ADC resolution
Levels
What a Bode sweep can typically resolve
8-bit
Title
256
256
Title
Moderate attenuation before readings reach the noise floor
Moderate attenuation before readings reach the noise floor
10-bit
Title
1,024
1,024
Title
Deeper stopbands, cleaner passband detail
Deeper stopbands, cleaner passband detail
14-bit
Title
16,384
16,384
Title
Deep stopbands, high PSRR values, small gain variations
Deep stopbands, high PSRR values, small gain variations
The HD304MSO carries a native 14-bit ADC with 16,384 levels and a noise floor around 50 µVRMS. That is 64 times the quantization resolution of an 8-bit scope, while Keysight App Note 5991-4088 explains why vertical accuracy and ENOB, not just bits, determine measurement quality. In Bode terms, the 14-bit front end gives you more room to measure a 70 dB stopband or a demanding PSRR sweep before the result reaches the measurement floor.
If ADC architecture is new to you, the analog-to-digital converter glossary entry covers the fundamentals. Many Bode plot guides explain the sweep, but fewer connect converter resolution to Bode measurement quality. That difference can decide whether you present the plot or re-measure it.
Which Keysight Oscilloscope Should You Use for Bode Plots?
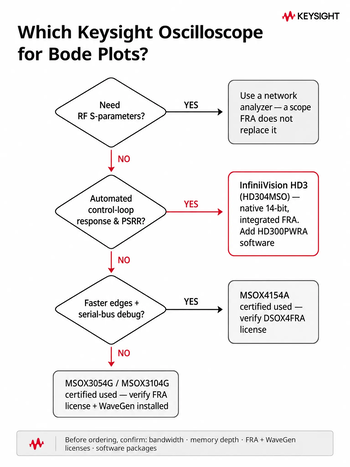
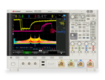
The Keysight InfiniiVision HD3 (HD304MSO) pairs a native 14-bit ADC with a 3.2 GSa/s sample rate, 200 MHz standard bandwidth upgradeable to 350 MHz, 500 MHz, or 1 GHz, 20 Mpts standard memory with 50 and 100 Mpts options, 4 analog plus 16 digital channels, a 1.3 million waveforms-per-second update rate, and integrated frequency response analysis driven by its 100 MHz WaveGen through the HD3WAVEGEN license option. Confirm the FRA sweep settings, application range, and WaveGen license on the product page before ordering.
The software stack matches the measurements in this guide: HD300PWRA automates power supply characterization, including control loop response and PSRR; HD300AUTA adds CAN/CAN FD/CAN XL/LIN/SENT decode for vehicle work; HD300EMBA covers embedded protocols; and HD300BDLA bundles all four packages.
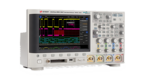
The value tier is the used InfiniiVision X-Series. Certified used MSOX3054G and MSOX3104G units can run FRA when the DSOXT3FRA license and WaveGen are installed. The MSOX4154A can do the same when DSOX4FRA and the required source option are enabled. Keysight lists the DSOXT3FRA license as obsolete, so for older X-Series models, a used unit with the license already installed may be the practical route.
| Tier | Example model | Key numbers | Fits |
|---|---|---|---|
| Precision 14-bit | HD304MSO | 14-bit, 3.2 GSa/s, 200 MHz to 1 GHz, 4+16 ch, integrated FRA | Loop stability, PSRR, deep stopbands |
| Mainstream used | MSOX3054G / MSOX3104G | 500 MHz / 1 GHz; verify FRA license + WaveGen on the listing | Teaching labs, filter corners, general bench |
| Step-up used | MSOX4154A | 1.5 GHz, 4+16 ch; verify DSOX4FRA on the listing | Faster edges plus serial bus debug |
Tier
Example model
Key numbers
Fits
Precision 14-bit
Title
HD304MSO
HD304MSO
Title
14-bit, 3.2 GSa/s, 200 MHz to 1 GHz, 4+16 ch, integrated FRA
14-bit, 3.2 GSa/s, 200 MHz to 1 GHz, 4+16 ch, integrated FRA
Title
Loop stability, PSRR, deep stopbands
Loop stability, PSRR, deep stopbands
Mainstream used
Title
MSOX3054G / MSOX3104G
MSOX3054G / MSOX3104G
Title
500 MHz / 1 GHz; verify FRA license + WaveGen on the listing
500 MHz / 1 GHz; verify FRA license + WaveGen on the listing
Title
Teaching labs, filter corners, general bench
Teaching labs, filter corners, general bench
Step-up used
Title
MSOX4154A
MSOX4154A
Title
1.5 GHz, 4+16 ch; verify DSOX4FRA on the listing
1.5 GHz, 4+16 ch; verify DSOX4FRA on the listing
Title
Faster edges plus serial bus debug
Faster edges plus serial bus debug
Fit by buyer: if you're the founder-engineer specifying your own bench, the HD3 combines scope, generator, and analyzer into one instrument and one purchaseorder. If you run a research lab, the education discount and documented calibration are the details your grant office will look for.
Not sure whether a listing includes the FRA license or WaveGen option? Ask before you buy. Request a quote on the unit, and our team can confirm the installed options and configuration against your requirements so the scope that arrives can run the sweep on day one.
Before you order any tier, run this 4-item pre-order check:
- Bandwidth: does the model (or its upgrade path) cover your fastest signals, not just the sweep range?
- Memory option: does the unit include 20 Mpts standard memory or the 50/100 Mpts options for long captures?
- FRA and WaveGen: is the HD3WAVEGEN license confirmed for HD3, or are the FRA license and WaveGen option confirmed on the used X-Series listing?
- Software licenses: do you need HD300PWRA for automated loop/PSRR measurements, or decode packages if buses share the bench?
What Does Bode Plot Capability Cost to Own?
Most Bode plot guides explain the measurement but say little about what it costs to own the capability. Bode capability is a stack: oscilloscope, generator, and analysis license. How you buy that stack can affect the price more than any single spec choice.
Certified used direct from the OEM changes the math: save 40 to 90% vs new, plus 5% extra for online purchases and 15% for education and research customers. Certified used units can include up to 5 years of warranty options and calibration documentation. Keysight Premium Used instruments pass a 101-point quality check, and KeysightCare technical support can back the bench. For research labs, check the education and research offers page for current discount terms, and keep calibration documentation ready for grant or audit requirements.
| Ownership path | What you get | What to check |
|---|---|---|
| New HD3 | Current list price, full factory coverage | Budget approval timeline |
| Certified used HD3 | 40 to 90% savings, up to 5 years warranty options | Stock and configuration |
| Keysight Premium Used HD3 | OEM-remanufactured, same final test as new: all the same, except for the price | When compliance documentation matters |
| Used MSOX + FRA license | Lowest entry to automated sweeps | License + WaveGen on the listing |
| USB multi-instrument | Low purchase price | Dynamic range, no calibrated margins, no OEM coverage path |
Ownership path
What you get
What to check
New HD3
Title
Current list price, full factory coverage
Current list price, full factory coverage
Title
Budget approval timeline
Budget approval timeline
Certified used HD3
Title
40 to 90% savings, up to 5 years warranty options
40 to 90% savings, up to 5 years warranty options
Title
Stock and configuration
Stock and configuration
Keysight Premium Used HD3
Title
OEM-remanufactured, same final test as new: all the same, except for the price
OEM-remanufactured, same final test as new: all the same, except for the price
Title
When compliance documentation matters
When compliance documentation matters
Used MSOX + FRA license
Title
Lowest entry to automated sweeps
Lowest entry to automated sweeps
Title
License + WaveGen on the listing
License + WaveGen on the listing
USB multi-instrument
Title
Low purchase price
Low purchase price
Title
Dynamic range, no calibrated margins, no OEM coverage path
Dynamic range, no calibrated margins, no OEM coverage path
Factor downtime into the comparison. Keysight notes that 78% of customers lose more than $25,000 a day when equipment fails, which is why support and warranty options belong in the cost comparison, not outside it. If usage is short-term, the buy vs rent comparison covers that path, and the Keysight Premium Used line is the answer when procurement insists on as-new documentation.
There is also a sustainability case for the same purchase order. The UN Global E-waste Monitor 2024 (UNITAR and ITU) reports a record 62 million tonnes of e-waste in 2022, with 22.3% formally collected and recycled, and projects 82 million tonnes by 2030. Keeping a calibrated instrument in service through the certified used market helps counter that trend.
If the budget window opens next quarter, create a Used Equipment Portal account (free of charge) to save the configurations you want and get notified when matching certified used units come into stock.
See certified used MSOX3054G / MSOX3104G pricing and configurations
Why Do Bode Plots Go Wrong?
Most bad Bode plots trace to stimulus level, injection, or probing mistakes, not the instrument. The consolidated checklist, in rough order of frequency:
- Stimulus too large: the DUT compresses or an op-amp stage saturates, and measured gain flattens into an inaccurate result
- Stimulus too small: readings sink into the noise floor and the phase trace becomes noisy
- Missing DC block on an active circuit: the sweep's offset pushes the stage out of its operating point
- Wrong injection point, or an injection resistor large enough to disturb the loop being measured
- Probe loading and termination errors shifting corners and faking peaking
- Points per decade too coarse: narrow resonances vanish between sweep points
- Measuring before thermal settling, or after changing the operating point without re-profiling amplitude
The two costliest mistakes are overdrive and injection errors. Overdrive is easy to miss because the plot may still look smooth. The problem is that the design decision made from it inherits the error. The fix is built into the scope workflow: watch VIN and VOUT live during the sweep, and reduce the amplitude as soon as the sine wave shows distortion. Injection errors can distort the low-frequency end of loop measurements. Keep the injection resistor small relative to the divider impedance, often in the tens of ohms, and inject where the loop impedance looking backward is low.
Probing is the third common issue: a 10x passive probe on a high-impedance node can add its own pole. That is why the refurbished oscilloscope probes buying guide belongs next to this article when you spec the bench.
Trust also depends on calibration. A sweep from an uncalibrated front end is hard to defend. The oscilloscope calibration guide and the certificate of calibration explainer cover what the paperwork should show before you present margins from the instrument.
Manual Sweep, Integrated FRA, USB Instrument, or Dedicated Analyzer?
Four routes can lead to a frequency response measurement, and each one fits a different budget, accuracy target, and workflow.
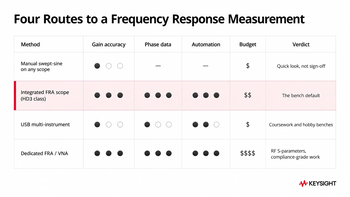
Here is the practical comparison:
| Method | Gain accuracy | Phase | Automation | Budget | Verdict |
|---|---|---|---|---|---|
| Manual swept-sine on any scope | Magnitude envelope only | None | None | No added instrument cost | Quick look, not sign-off |
| Integrated FRA (HD3 class) | Calibrated dB per point | Yes, with margins | Automated sweep + export | Certified used mid-range | The bench default |
| USB multi-instrument | Often limited by dynamic range | Partial | Scripted | Low | Coursework and hobby benches |
| Dedicated FRA / VNA | Highest, RF-capable | Yes | Full | Highest | RF S-parameters, compliance-grade work |
Method
Gain accuracy
Phase
Automation
Budget
Verdict
Manual swept-sine on any scope
Title
Magnitude envelope only
Magnitude envelope only
Title
None
None
Title
None
None
Title
No added instrument cost
No added instrument cost
Title
Quick look, not sign-off
Quick look, not sign-off
Integrated FRA (HD3 class)
Title
Calibrated dB per point
Calibrated dB per point
Title
Yes, with margins
Yes, with margins
Title
Automated sweep + export
Automated sweep + export
Title
Certified used mid-range
Certified used mid-range
Title
The bench default
The bench default
USB multi-instrument
Title
Often limited by dynamic range
Often limited by dynamic range
Title
Partial
Partial
Title
Scripted
Scripted
Title
Low
Low
Title
Coursework and hobby benches
Coursework and hobby benches
Dedicated FRA / VNA
Title
Highest, RF-capable
Highest, RF-capable
Title
Yes
Yes
Title
Full
Full
Title
Highest
Highest
Title
RF S-parameters, compliance-grade work
RF S-parameters, compliance-grade work
The manual method still has a place: sweep a sine upward, watch the output envelope on persistence, and you get a real-time magnitude picture on many scopes with no FRA license required. It's a useful sanity check. What it cannot give you is calibrated dB, phase, margins, or repeatability, which is what a design record needs.
For loops, filters, and PSRR on a bench budget, the integrated-FRA scope tier answers the practical measurement need: calibrated gain and phase data, automated sweeps, and exportable results in the same instrument that handles the rest of the bench week. A network analyzer stays necessary for RF S-parameter work; a scope-based FRA does not replace that role.
Conclusion: Measure the Margin Before It Ships
Three things to carry back to the bench: a scope with an FRA function can produce calibrated gain and phase plots you can use with confidence; ADC resolution helps define the measurement floor, which is why the 14-bit HD304MSO anchors this guide; and certified used equipment bought direct from the OEM can put that capability within reach of a startup or grant budget, with up to 5 years of warranty options.
Browse the certified used inventory and request a quote.
Select up to 3 instruments to compare
Select another instrument to compare
![]()
Starting at
Select another instrument to compare
![]()
Starting at
Select another instrument to compare
![]()
Starting at
Whenever You’re Ready, Here Are
5 Ways We Can Help You
1
2
Call tech support US: +1 800 829-4444
Press #, then 2. Hours: 7am – 5pm MT, Mon– Fri
3
Contact our sales support team
4
Create an account to get price alerts and access to exclusive waitlists
5
Talk to your account manager about your specific needs
Sources
- H. W. Bode, Relations Between Attenuation and Phase in Feedback Amplifier Design, Bell System Technical Journal 19(3), 1940
- R. D. Middlebrook, Measurement of Loop Gain in Feedback Systems, International Journal of Electronics 38(4), 1975
- IEEE Std 1057-2017, Standard for Digitizing Waveform Recorders
- Henry Zhang, Understand Power Supply Loop Stability and Loop Compensation, Part 3, Analog Devices
- Walt Kester, MT-001: SNR = 6.02N + 1.76 dB, Analog Devices
Frequently Asked Questions
A Bode plot graphs a circuit's frequency response:
- Gain in dB on a logarithmic frequency axis
- Phase in degrees on the same axis
- Corners and margins readable at a glance
Note: the name honors Hendrik W. Bode of Bell Labs, who published the method in 1940.
Yes, the frequency response analyzer is integrated:
- The 100 MHz WaveGen (HD3WAVEGEN license; confirm it's on the unit) supplies the stimulus
- 2 of its 4 analog channels capture input and output
- 14-bit ADC improves measurement resolution
Automated control loop response and PSRR measurements require HD300PWRA.
Read the -3 dB point:
- Find the flat passband gain level
- Follow the gain trace to 3 dB below it
- That frequency is the bandwidth
Note: for filters, the same point is the corner frequency.
They quantify stability headroom:
- Phase margin: 180 degrees minus phase lag at gain crossover
- Gain margin: gain deficit at phase crossover
- Working targets: 45 to 60 degrees, 6 to 10 dB
Some analyses place critically damped response closer to 76 degrees of phase margin.
Check before you buy:
- The listing's installed-options line (DSOXT3FRA or DSOX4FRA)
- WaveGen option present
- Ask our team to confirm the configuration
Note: Some FRA licenses for older X-Series models are obsolete for new sale, so installed options matter.
For many loop, filter, and PSRR design decisions, yes, when the setup is correct:
- Calibrated gain and phase per sweep point
- HD304MSO: 14-bit ADC, about 50 µVRMS noise floor
- Export margins for the design record
However: RF S-parameter work still belongs to a network analyzer.
Yes, with the power analysis package:
- HD300PWRA automates PSRR vs frequency
- Same package covers control loop response
- 14-bit resolution helps keep high PSRR measurements above the measurement floor
Note: plan the injection hardware for your rail before testing.
Certified used instruments can include up to 5 years of warranty options, KeysightCare technical support access, and calibration documentation that supports audits and grant compliance. Keysight Premium Used units additionally pass a final 101-point quality check.
Browse available options and request a quote