How to Test CAN Bus Signal Quality with Eye Diagrams

Evaluate CAN Physical-Layer Signal Quality
CAN is a differential serial bus used throughout automotive systems to exchange control and status information between electronic control units (ECUs). As messages travel across the network, propagation delay, jitter, edge distortion, and other physical-layer effects can influence overall CAN signal quality. Engineers need a practical way to evaluate whether the electrical characteristics of the bus remain within acceptable limits before these effects begin impacting communication reliability. A CAN eye diagram combines many waveform acquisitions into a single display, providing a comprehensive view of CAN physical-layer performance rather than the behavior of an individual frame. This makes it possible to evaluate the overall quality of the bus and quickly identify waveform characteristics that may indicate degraded signal integrity.
Performing the test requires an oscilloscope connected across the differential CAN bus using a differential active probe. Engineers use automotive oscilloscope software to enable CAN triggering, protocol decoding, CAN eye diagram generation, and automated mask testing while capturing repeated CAN waveforms. The resulting display highlights eye opening, jitter, edge behavior, and mask violations that may indicate reduced CAN signal quality. Instead of reviewing individual waveform captures one at a time, engineers can evaluate the overall condition of the CAN physical layer in a single measurement, making it easier to identify signal integrity issues, compare waveform quality against the mask, and verify that the bus meets expected communication performance requirements.

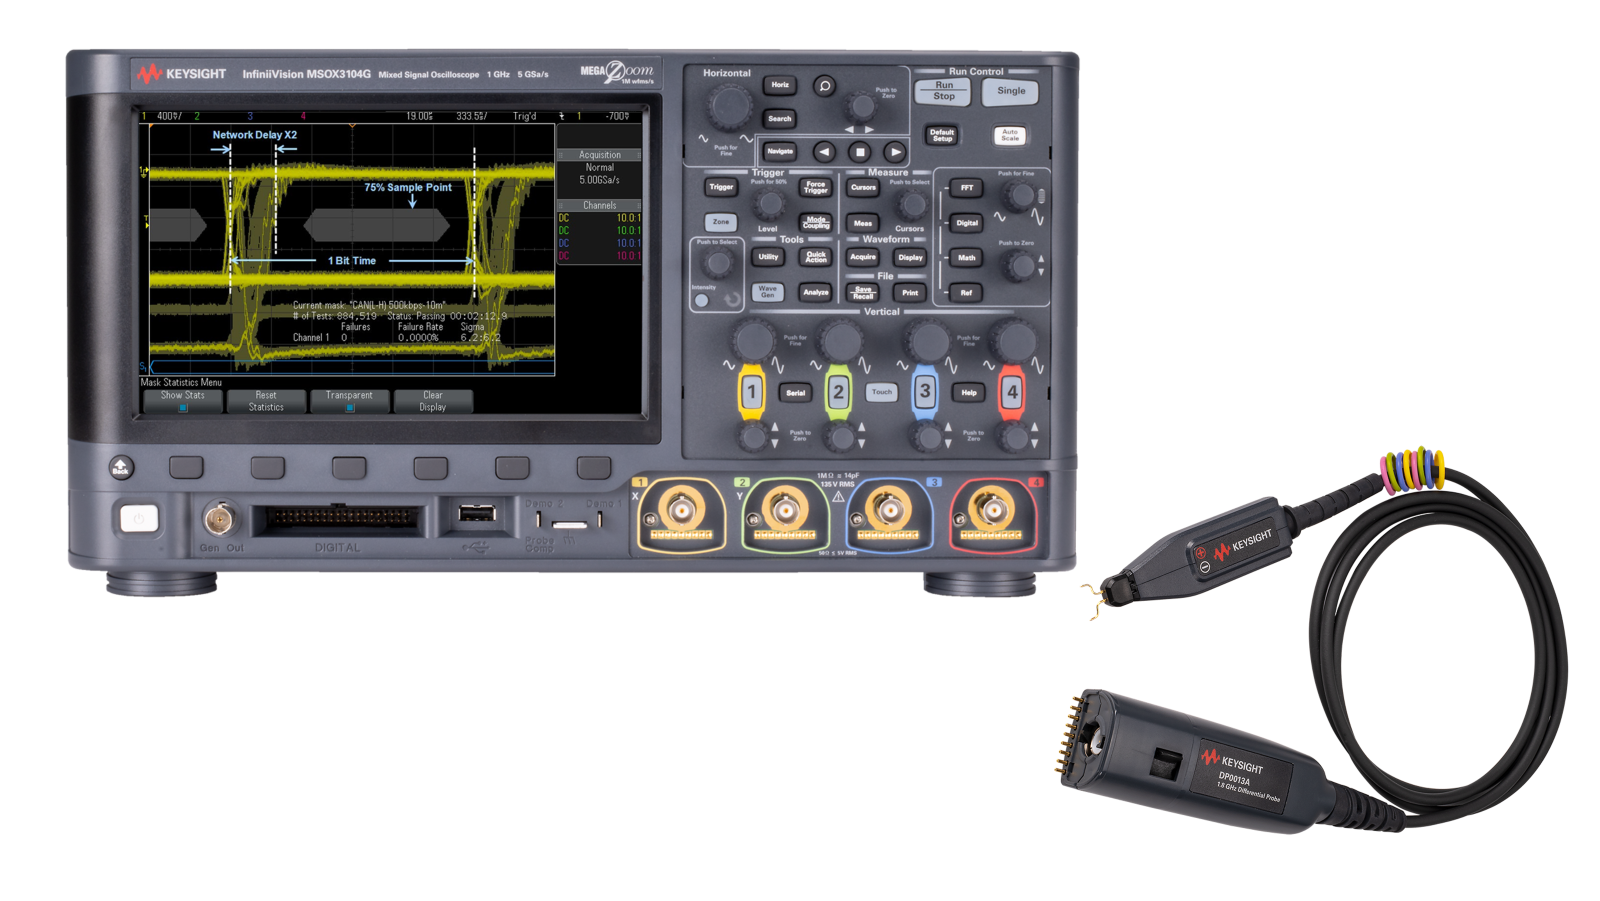
CAN Eye Diagram Analysis Solution
See Demo of CAN Signal Quality and Eye Diagram Analysis
Explore Products in Our CAN Eye Diagram Analysis Solution
-


![]()
D3000AUTB Automotive Software For The 3000A/T/G X-Series
-

![]()
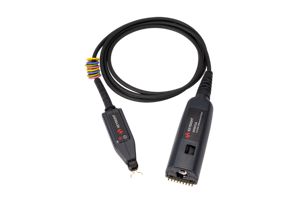
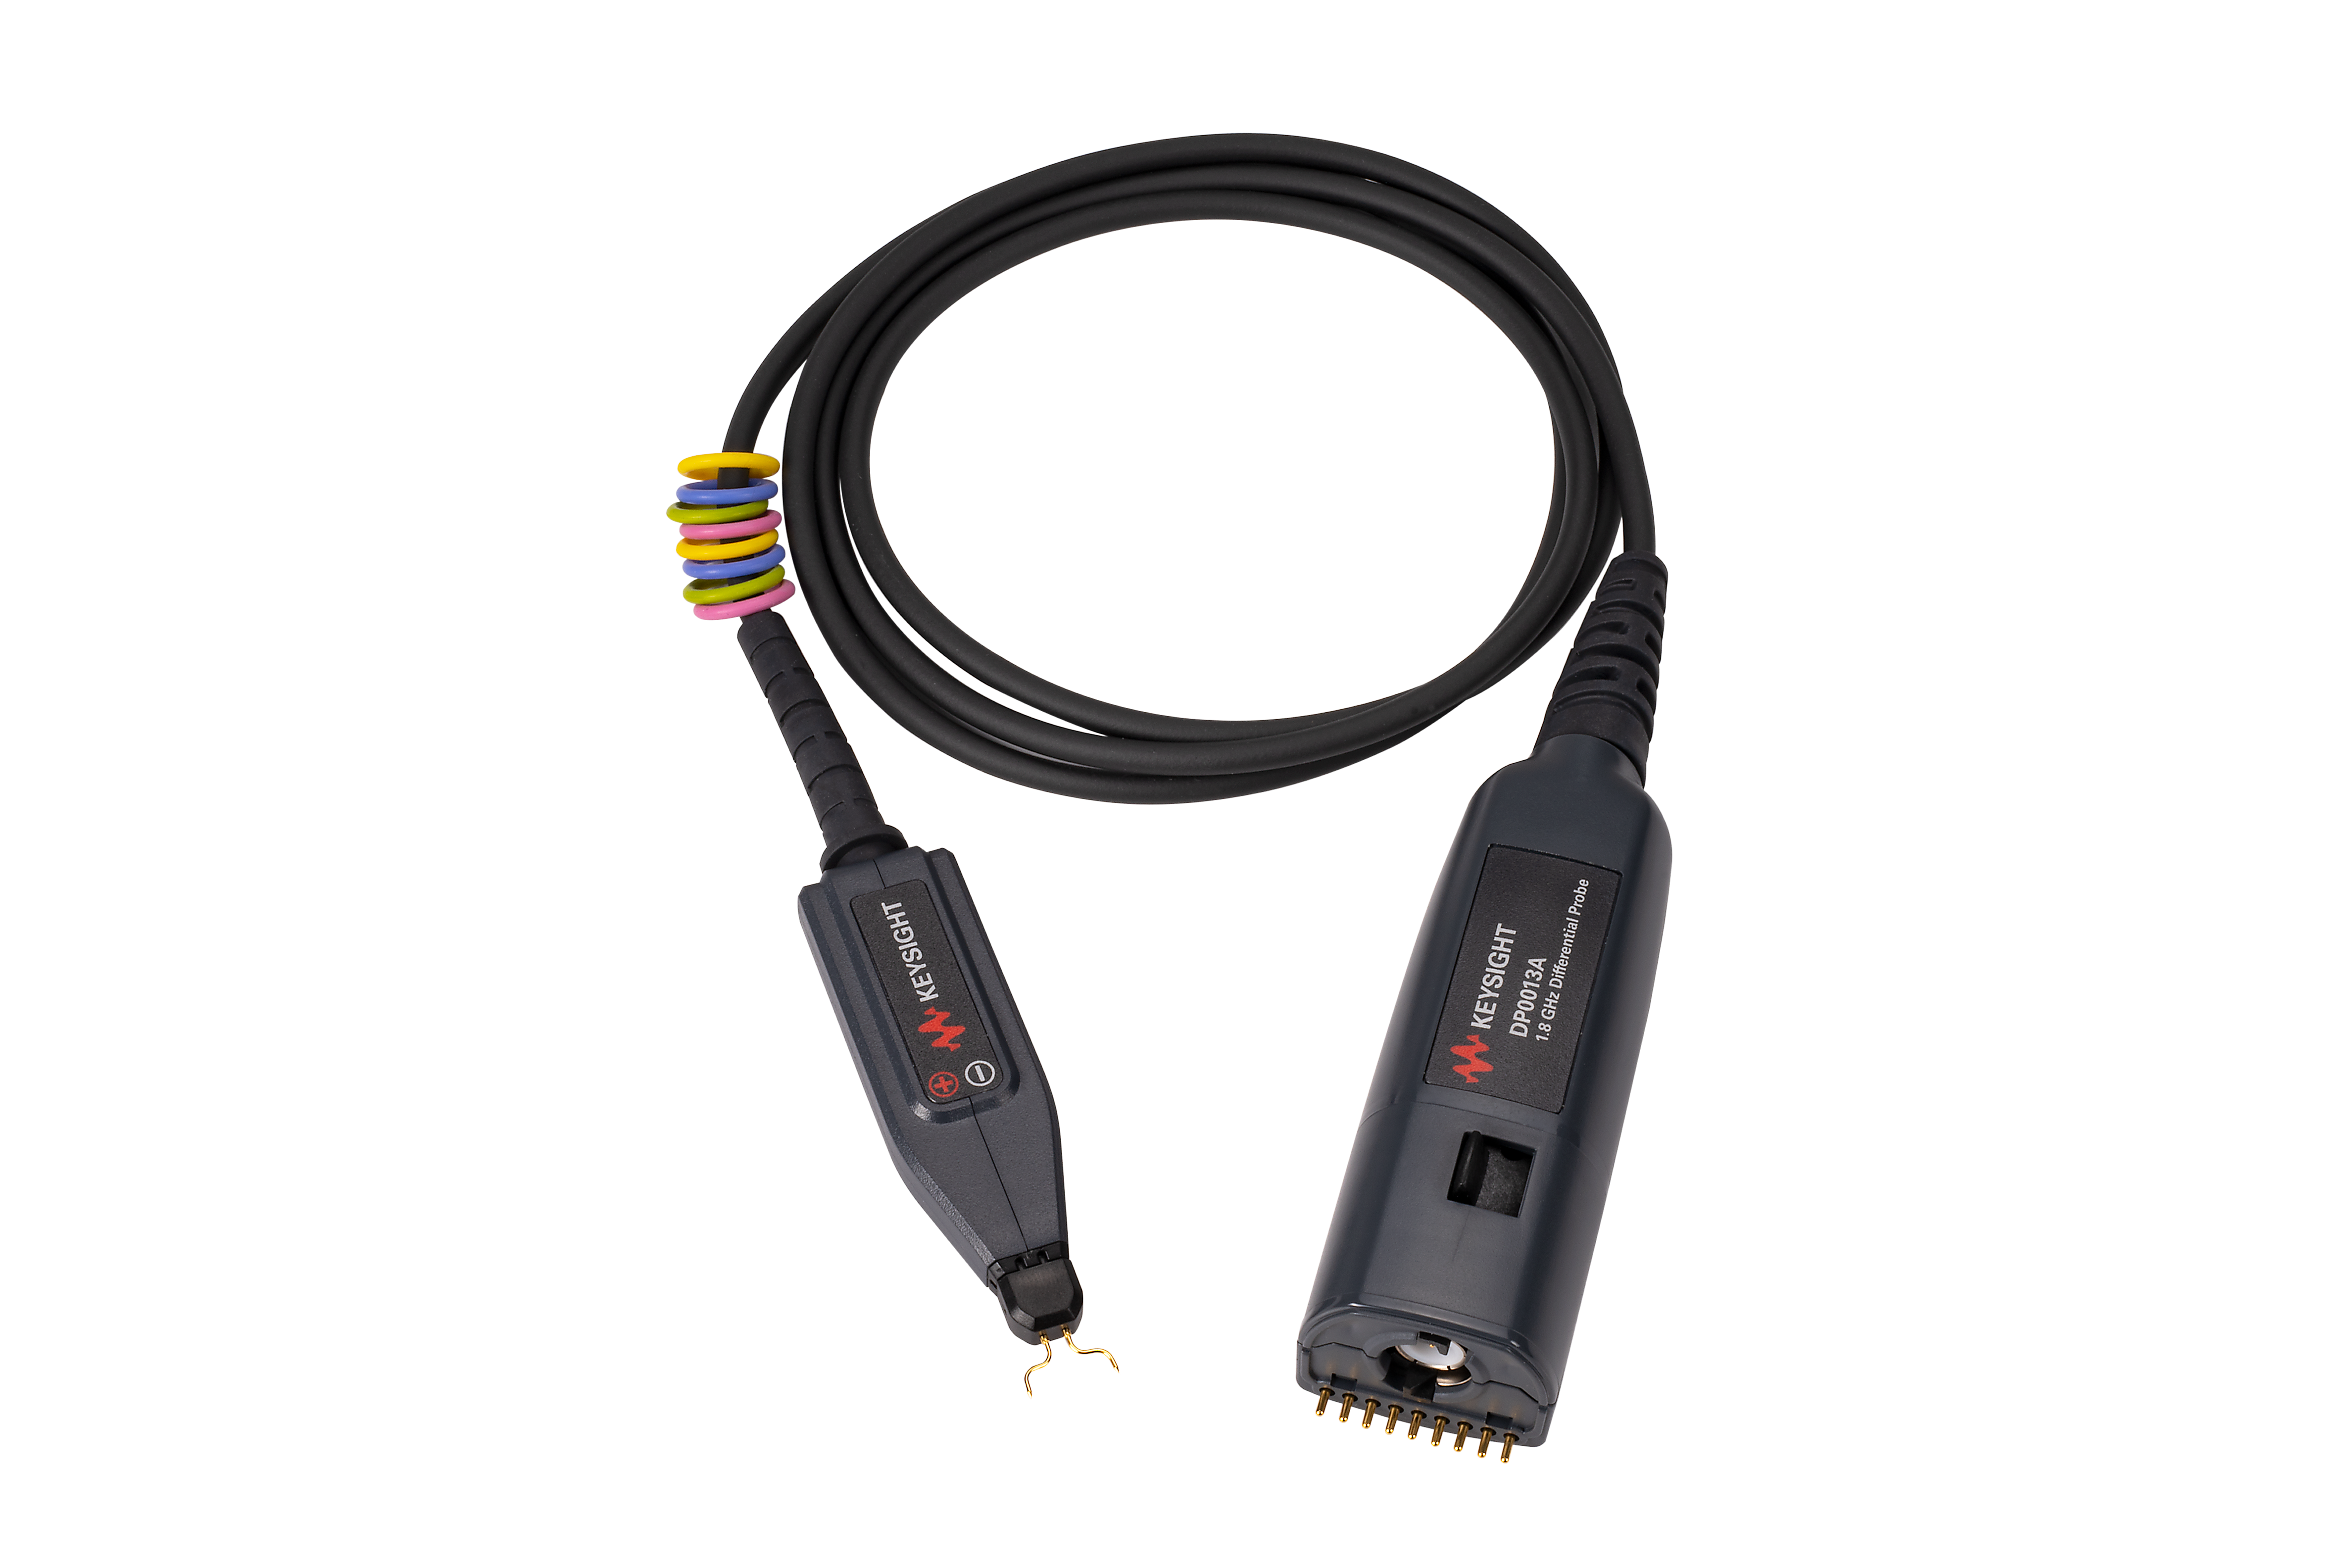
DP0011A Differential Active Probe, 500 MHz
-
![]()
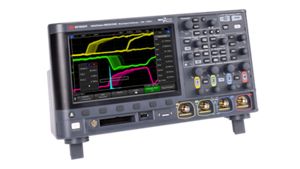
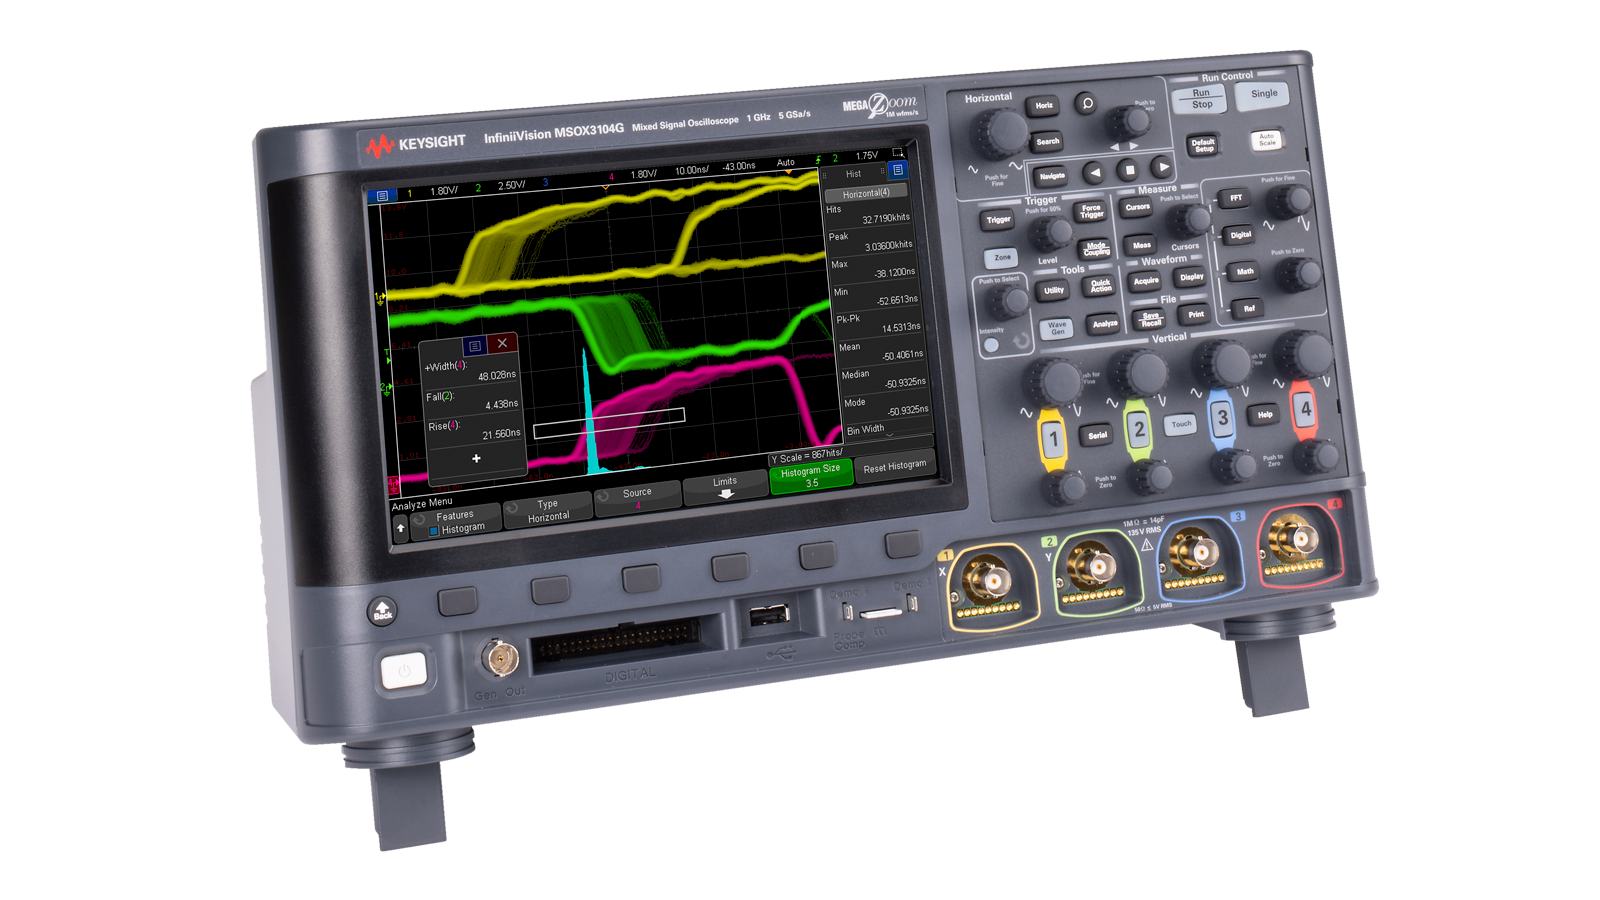
MSOX3104G Mixed Signal Oscilloscope: 1 GHz, 4 Analog Plus 16 Digital Channels


Discover Resources and Insights
Additional Resources for CAN Eye Diagram Analysis
Related Use Cases

-
![]()
Learn More
How to Find Intermittent Errors on Automotive Serial Buses
Find intermittent automotive serial bus errors using an Essential benchtop oscilloscope with hardware-based decoding and segmented memory.
Learn More

-
![]()
Learn More
How to Isolate CAN Bus Arbitration
Isolate CAN bus arbitration using an Essential Benchtop Oscilloscope with zone triggering, CAN message qualification, and segmented memory.
Learn More
-
![]()
Learn More
How to Trace Data Across Automotive Serial Bus Gateways
Trace data across automotive serial bus gateways using an Essential benchtop oscilloscope with dual-bus decoding and a time-interleaved protocol lister.
Learn More

Get in Touch with One of Our Experts
Need help finding the right solution for you?