FieldFox Spectrum Observation
Vorführung
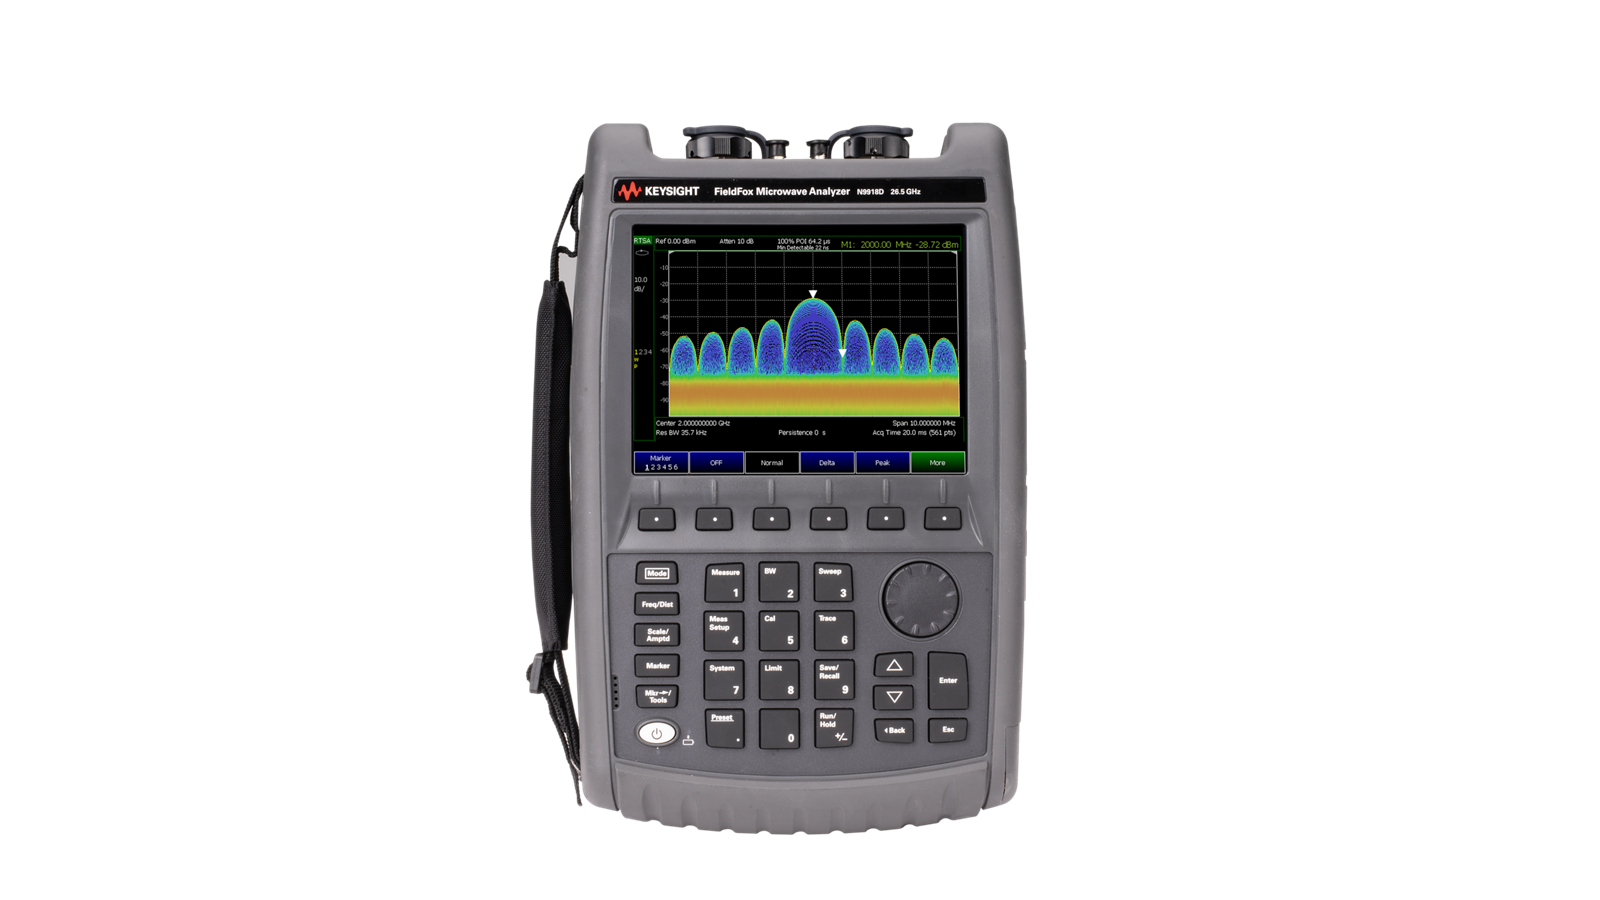
This video demonstrates how the Keysight FieldFox handheld analyzer enables real-time spectrum observation and analysis across a variety of wireless signal environments. Using practical examples from both Wi-Fi and FM broadcast bands, the demonstration showcases how FieldFox helps engineers, technicians, and spectrum managers detect, visualize, and understand RF activity that may be difficult to capture using conventional swept spectrum analysis techniques.
The demonstration begins by configuring FieldFox in spectrum analyzer mode to monitor activity within the 2.3 GHz to 2.7 GHz frequency range, a spectrum region commonly associated with Wi-Fi communications and other wireless technologies. Viewers are introduced to the instrument's real-time spectrum analysis (RTSA) capability, which continuously captures and displays RF activity without measurement gaps. Unlike traditional sweep-based methods, RTSA enables users to observe short-duration transmissions, burst signals, and intermittent interference events that can otherwise go undetected. This capability is particularly valuable when troubleshooting wireless networks, identifying unknown emitters, or monitoring dynamic RF environments.
As the demonstration progresses, viewers learn how to optimize signal visibility by adjusting amplitude scales and reference levels. These controls help separate meaningful signal activity from background noise and provide a clearer understanding of spectrum utilization. The video illustrates how FieldFox can reveal varying levels of channel occupancy and signal behavior, helping users quickly identify active transmissions and assess overall spectrum conditions.
The density display feature is also highlighted as a powerful visualization tool for spectrum observation. By displaying how frequently signals occur over time, density mode enables users to distinguish between persistent transmissions and sporadic activity. This enhanced visibility provides deeper insight into signal behavior and helps users identify trends that may not be obvious in a standard spectrum display.
To demonstrate FieldFox's versatility across different signal types, the video transitions to the FM broadcast band near 98 MHz. Here, viewers observe stable broadcast transmissions and learn how measurement settings can be tailored to different RF environments. The demonstration explores the use of preamplifier and attenuation controls to improve receiver sensitivity, optimize dynamic range, and enhance the visibility of lower-level signals. These features allow users to adapt measurement performance based on signal conditions and monitoring objectives.
The video also demonstrates the Max Hold trace function, which records peak signal levels over time to build a comprehensive view of spectrum activity. This capability is particularly useful for identifying intermittent signals that may only appear briefly during a measurement period. Returning to the Wi-Fi band, the demonstration shows how Max Hold can reveal a more complete picture of channel occupancy and wireless activity patterns.
Throughout the video, viewers gain practical insight into FieldFox's spectrum observation workflow and key measurement capabilities. By combining real-time spectrum analysis, density display visualization, sensitivity optimization, and advanced trace functions in a rugged portable platform, FieldFox provides a powerful solution for RF troubleshooting, interference hunting, spectrum monitoring, wireless network analysis, and field-based signal investigation. The demonstration highlights how users can quickly gain actionable spectrum awareness and confidently characterize RF environments in both commercial and mission-critical applications. The video also highlights how FieldFox combines laboratory-grade measurement performance with the portability needed for efficient spectrum awareness and RF analysis in the field.