Tech Guides
How To Use A Spectrum Analyzer: Step-by-Step Guide For Engineers


Introduction
Imagine working on a new RF design and running into unexpected interference or spurious signals. Without the right tools, identifying the problem can take hours of guesswork.
A spectrum analyzer turns that challenge into clarity by showing exactly how signal power is distributed across frequencies. From detecting hidden sources of noise to verifying device performance against industry standards, this instrument is one of the most versatile tools in an engineer’s lab.
Yet many professionals still struggle to get consistent, accurate results. The reason isn’t a lack of expertise, but the absence of clear, step-by-step guidance that connects fundamental concepts with practical measurement techniques. This guide bridges that gap. By the end, you’ll not only know how to set up and configure a spectrum analyzer, but also how to interpret results, avoid common mistakes, and apply proven techniques to your own projects.
For engineers who may also be evaluating equipment, the Spectrum Analyzer Buying Guide provides additional details on models, features, and selection criteria. Together, these resources give you both the operational skills and purchasing insights needed to make spectrum analysis a reliable part of your workflow.
What Is a Spectrum Analyzer and When Is It Used?
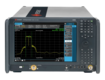
A spectrum analyzer is a test instrument that displays how the power of a signal is distributed across frequency.
Instead of showing signal changes over time, as an oscilloscope does, a spectrum analyzer plots signal amplitude (vertical axis) against frequency (horizontal axis). This makes it possible to identify not only the main carrier frequency but also noise, harmonics, spurious signals, and unwanted interference that can affect system performance.
At its core, spectrum analysis is about understanding four main concepts:
- Power vs. frequency: how strong a signal is at each point across the spectrum
- Bandwidth types: such as occupied bandwidth or channel bandwidth, which describe how wide a signal spreads
- Modulation schemes: AM, FM, QAM, OFDM, and others, which determine how information is carried and appear clearly in frequency-domain measurements
- Amplitude scaling: adjusting the display so small signals are visible alongside stronger ones, ensuring accurate data interpretation
The ability to view and analyze signals in this way is essential in industries like telecommunications, automotive electronics, aerospace, defense, and wireless R&D. Engineers use spectrum analyzers to verify that devices meet regulatory standards, troubleshoot interference in crowded environments, and optimize designs for efficiency and reliability.
There are also common misconceptions worth clearing up. A spectrum analyzer does far more than “only measure frequency”. It measures signal power across a range of frequencies with high accuracy, helping distinguish distortion from true signal components.
And while some may think the instrument is too complex for beginners, modern models are designed with intuitive controls and built-in measurement functions. Anyone with a grounding in basic RF theory can learn to operate one effectively.
If you’re still building that foundation, our Oscilloscope Basics Guide is a good starting point before diving deeper into spectrum analysis.
Step-by-Step Instructions for Using a Spectrum Analyzer
Operating a spectrum analyzer becomes much easier when you follow a structured flow. The process starts with connecting your device under test, moves through frequency and amplitude configuration, and ends with interpreting signal results. Each step builds on the previous one, ensuring your measurements are accurate and repeatable.
Step 1: Setup and Connection
Begin by connecting your DUT to the analyzer’s input port using high-quality cables and connectors. Power on the analyzer only after confirming secure connections. This reduces the risk of damage from static discharge or poor grounding. When the setup is correct, the analyzer will be stable, protected, and ready to measure signals reliably.
Common mistakes to avoid: Using worn connectors, exceeding input power limits, or forgetting to properly ground the DUT. These errors can cause inaccurate results or permanent instrument damage.
Step 2: Configuring Frequency Range
Set the frequency range you want to analyze. Most engineers use center frequency and span controls, which let you quickly zoom in or out of a signal of interest. Alternatively, you can enter start and stop frequencies for precise windowing.
Choose ranges based on the type of signal. For example, Wi-Fi measurements often require spans in the GHz range, while audio or baseband signals use narrower spans. A helpful tip is to begin with a wide span to locate the signal, then reduce it for a closer view.
With the proper settings, the signal of interest appears within the correct frequency window, without missing adjacent activity. For more details, see our Spectrum Analyzer Frequency Settings Guide.
Step 3: Adjusting Amplitude Settings
Set the reference level (the top of the display scale) and input attenuation to match the signal’s expected strength. Proper adjustment prevents the display from clipping while keeping weaker signals above the noise floor.
Automatic attenuation works well in many cases, but for sensitive measurements, manual control allows greater precision. Adding a preamplifier can also improve detection of very low-level signals. With these settings dialed in, the analyzer provides a clear, unclipped display that maximizes dynamic range for accurate readings.
Step 4: Resolution Bandwidth (RBW) and Video Bandwidth (VBW) Settings
Resolution bandwidth (RBW) determines how finely the analyzer separates signals. A narrower RBW provides better resolution but slows the sweep speed. Video bandwidth (VBW) controls how much the trace is smoothed, reducing noise for easier interpretation.
A good rule of thumb: use narrower RBW and VBW for detailed analysis, and wider settings for faster sweeps. Balancing these parameters reduces noise and produces a clear view of the signal’s true shape and details.
Step 5: Signal Measurement and Interpretation
Once the analyzer is configured, you can begin characterizing the signal. Use markers to identify peak frequencies and measure signal power directly. Advanced functions like peak search quickly locate maximum amplitudes, while delta markers show frequency differences between peaks.
These tools make it easier to identify harmonics, spurious emissions, and distortion products. With effective use of markers and trace math, you gain a precise view of both expected performance and any issues that require troubleshooting.
Frequency Range and Span Settings
A spectrum analyzer’s frequency controls determine how much of the spectrum you see at once and how precisely you can examine individual signals.
Two common methods are used: setting a center frequency with a span or entering start and stop frequencies. Center and span controls are often more intuitive, letting you zoom in and out around a signal of interest. Start/stop settings give you exact boundaries when precision is required.
Typical spans vary by application. For example, Wi-Fi analysis often uses a span in the 20–100 MHz range. LTE requires wider ranges to capture multiple channels, and Bluetooth devices usually fit within narrower spans of a few megahertz. Starting with a wide span helps locate signals across the spectrum, and then reducing the span provides a closer look at the details. Using the “marker to center” function further speeds up the process, bringing the signal of interest to the display center with one adjustment.
With the right span settings, signals appear quickly in the correct window, reducing the chance of missing nearby activity.
Attenuation and Reference Level
Amplitude settings are just as important as frequency controls when working with a spectrum analyzer. The reference level defines the top of the display scale, while input attenuation reduces the strength of incoming signals before they reach the analyzer’s sensitive front end. Setting these parameters correctly ensures that strong signals don’t clip and weaker ones remain visible.
Most analyzers offer both automatic and manual attenuation. Auto attenuation works well for general-purpose measurements, but manual control gives you more precision in situations where accuracy is critical. Adding a preamplifier can also help detect very low-level signals that would otherwise be lost in the noise floor.
Modern analyzers provide overload indicators that warn when input levels are too high. Ignoring these can distort results or even damage the instrument. Proper attenuation improves measurement accuracy and protects the analyzer’s front end, extending its usable life.
With the right balance of reference level and attenuation, the display remains clean and unclipped, giving you the widest possible dynamic range for accurate measurement.
Troubleshooting Common Issues
Even with the correct setup, engineers often encounter challenges when using spectrum analyzers. Recognizing the symptoms and applying quick fixes can save time and prevent unnecessary downtime.
| Problem | Possible Cause | Practical Fix |
|---|---|---|
| No signal displayed | Loose connections, wrong frequency range, DUT not powered | Recheck RF connections, confirm device power, reset center frequency/span settings |
| Distorted display | Input overload, incorrect attenuation, damaged cable | Adjust reference level or attenuation, replace worn cables, verify input limits |
| Excessive noise floor | RBW/VBW set too narrow, weak signal, dirty connectors | Broaden RBW/VBW, use a preamp, clean connectors and cables |
| Calibration errors | Analyzer drift, outdated calibration, environmental changes | Run built-in self-calibration, schedule professional calibration service |
If these steps do not resolve the issue, or if overload warnings persist despite adjustments, professional servicing may be required. Hardware failures, software glitches, or persistent calibration drift are best addressed through an authorized service center. This ensures the analyzer maintains the accuracy and reliability needed for compliance testing and critical measurements.
Advanced Tips and Variations
Once you’re comfortable with the basics, spectrum analyzers offer advanced features that can unlock deeper insights into signal behavior. These functions are especially useful in demanding applications such as compliance testing, R&D, and wireless system validation.
Expert Tactics for Power Users
- Zero Span Mode: Switch the analyzer to display amplitude versus time at a single frequency. This is valuable for measuring pulsed signals, burst transmissions, or time-domain characteristics.
- Phase Noise Measurement: Use narrow RBW settings to evaluate phase noise near a carrier. This is critical in oscillator design, radar systems, and communication links where signal purity impacts performance.
- Averaging Functions: Apply trace or video averaging to reduce random noise and improve measurement stability. This makes weak signals more visible without distorting their characteristics.
- Trace Math: Subtract, add, or average multiple traces to isolate specific signal behaviors. Engineers often use this to compare DUT performance under different conditions or to remove known background noise.
Vector Signal Analyzer (VSA) Comparison
For signals with complex modulation schemes, a Vector Signal Analyzer provides capabilities beyond traditional spectrum analysis. While a standard analyzer shows amplitude vs. frequency, a VSA can capture both amplitude and phase information, making it possible to fully demodulate signals like QAM, OFDM, or LTE. This is invaluable in wireless communications testing, where compliance with standards depends on detailed modulation accuracy.
Customizing for Specialized Applications
Spectrum analyzers can also be tailored for unique testing scenarios:
- EMC testing: Apply specific resolution bandwidths, detectors, and limit lines to compare emissions against regulatory standards.
- Wireless standards validation: Use predefined test modes or software applications for technologies like Wi-Fi, LTE, or 5G.
- Spectrum masks: Configure limit masks to quickly confirm whether a device stays within allowed emission boundaries.
These advanced variations extend the analyzer from a general-purpose tool into a specialized instrument capable of addressing compliance, research, and development needs with precision.

Real-World Applications
Spectrum analyzers are integral to modern engineering workflows across industries. They provide insights that time-domain tools cannot, making them indispensable in design, validation, and troubleshooting.
- Troubleshooting wireless communication systems: Engineers use analyzers to identify interference sources, measure channel occupancy, and verify compliance with spectrum allocations. This is especially important in crowded bands like Wi-Fi and 5G.
- Semiconductor device component testing: During design and production, analyzers help characterize oscillators, mixers, and RF amplifiers. Engineers can measure distortion, harmonics, and noise performance before components move into final systems.
- EMC/EMI compliance verification: Regulatory testing requires strict adherence to emission limits. Spectrum analyzers allow pre-compliance checks in the lab, helping reduce costly failures at external certification facilities.
- Radar and automotive ADAS signal analysis: Radar systems in aerospace and automotive advanced driver assistance systems (ADAS) depend on clean, stable signals. Spectrum analyzers measure chirp linearity, detect spurious emissions, and ensure safety-critical performance.
- Research & development of novel RF products: In cutting-edge R&D, analyzers support the exploration of new modulation schemes, wideband systems, and experimental communication protocols.
Common Challenges in Practice
| Challenge | Impact | Solution with Spectrum Analyzers |
|---|---|---|
| Interference in crowded frequency bands | Degraded signal quality, dropped links | Pinpoint interference sources and quantify their effects |
| Component variability | Inconsistent RF performance | Characterize distortion and harmonics across multiple devices |
| Failing compliance tests | Delays in product launch, added costs | Run in-house pre-compliance scans with correct settings |
| Transient or pulsed signals | Missed events in time-averaged displays | Use real-time spectrum analysis or zero-span mode |
These applications demonstrate how spectrum analyzers support both day-to-day troubleshooting and long-term innovation, helping engineers move from problem discovery to reliable solutions.
Additional Resources
The right accessories and learning materials can significantly improve both the accuracy of your measurements and your confidence in using a spectrum analyzer.
Essential supplementary tools
- Calibration kits: Regular calibration helps maintain accuracy and compliance with standards. Kits provide precision terminations, adapters, and standards for verifying analyzer performance.
- High-quality RF connectors: Poor connectors can introduce reflections, loss, or distortion. Using precision-grade connectors ensures repeatable measurements.
- Flexible low-loss cables: Durable, phase-stable cables reduce measurement uncertainty, especially when working at higher frequencies or with repeated connections.
Recommended learning materials
Engineers looking to deepen their knowledge often rely on well-reviewed textbooks such as Spectrum and Network Measurements by Robert A. Witte, along with updated RF measurement handbooks. The MIT OpenCourseWare Signals and Systems course provides a strong academic foundation in frequency-domain analysis that directly supports spectrum analyzer use. In addition, online courses from platforms like IEEE and Coursera provide structured learning on RF fundamentals and advanced spectrum analysis.
Active online communities
Technical forums such as the IEEE Collabratec community, and the Keysight Knowledge Center are valuable spaces to share challenges and solutions. These communities often feature troubleshooting advice, application notes, and real-world examples from other engineers working with similar test setups.
By combining reliable accessories with continuous learning and peer collaboration, engineers can extend the capabilities of their spectrum analyzers and maintain confidence in their measurement results.
Conclusion
Mastering a spectrum analyzer comes down to understanding both the fundamentals and the finer details of operation. From proper setup and frequency selection to adjusting amplitude, bandwidth settings, and interpreting results, each step builds toward accurate and reliable measurements.
The best way to strengthen these skills is through hands-on experience. Start by practicing with real signals in your lab, experiment with different bandwidth and attenuation settings, and explore advanced modes for more complex applications. Joining professional communities and continuing education courses will also keep you connected to the latest best practices and innovations in spectrum analysis.
Looking to enhance your lab with precision instruments without breaking the budget? Keysight’s Premium Used Equipment includes spectrum analyzers, oscilloscopes, and other RF test tools—professional-grade instruments designed to deliver accuracy and reliability. Each item is thoroughly inspected and pre-calibrated, giving you the confidence that your measurements will be precise from the start.
Whenever You’re Ready, Here Are
5 Ways We Can Help You
Browse our premium used network analyzers, oscilloscopes, signal analyzers and waveform generators
Call tech support US: +1 800 829-4444
Press #, then 2. Hours: 7am – 5pm MT, Mon– Fri
Contact our sales support team
Create an account to get price alerts and access to exclusive waitlists
Talk to your account manager about your specific needs
FAQs
What is a spectrum analyzer and how is it used in RF testing?
A spectrum analyzer measures signal power versus frequency and displays signal strength across frequency bands. Engineers use it to detect interference, harmonics, or distortions that may affect performance. Different analyzer types are suited to different applications, so choosing the right one depends on your testing needs.
Why is calibration important for spectrum analyzer accuracy?
Calibration ensures measurement precision, aligns results with industry standards, and minimizes errors caused by equipment drift or aging. Regular calibration is essential to maintain confidence in your results over time.
What are the benefits of Keysight Premium Used equipment?
Keysight Premium Used equipment is refurbished to like-new condition, comes with certified quality checks, and includes warranty and support. It offers a cost-effective way to access professional-grade tools without compromising reliability.
What types of spectrum analyzers exist and when should each be used?
- Swept analyzers are ideal for steady, continuous signals.
- Real-time analyzers capture transient or dynamic signals that would otherwise be missed.
- Vector signal analyzers provide deeper insights into complex modulation formats. Your application determines which type will deliver the most accurate results.
How do local oscillators and filtering improve measurements?
Local oscillators shift signals into a range where they can be processed, while filters remove unwanted noise and interference. Together, they enhance signal clarity and expand the analyzer’s dynamic range, especially in noisy environments.
Can Keysight equipment be customized for specific testing needs?
Yes. Hardware and software customization options allow analyzers to fit unique lab or field requirements. Expert technical support helps ensure smooth integration into your setup. Many clients also value the fast delivery times of Premium Used equipment, which often arrives sooner than new systems.
What warranty and support are available for refurbished analyzers?
Keysight Premium Used analyzers include industry-leading warranty coverage, access to KeysightCare support, and options for extended warranties and calibration services. This comprehensive service helps minimize downtime and ensures reliable long-term performance.