


Title
Sweeps the span past a narrow IF filter
Oscilloscope Glossary
What Is a Spectrum Analyzer? A Beginner's Guide

Introduction
A spectrum analyzer shows how a signal's amplitude varies across different frequencies. While an oscilloscope shows how a signal changes over time, a spectrum analyzer helps you identify frequency components, harmonics, and interference.
This guide explains how spectrum analyzers work, the main types available, and how to take your first measurement. For help comparing models, see the spectrum analyzer buying guide.
Overview
- A spectrum analyzer displays signal amplitude against frequency. An oscilloscope displays amplitude against time.
- Swept-tuned analyzers scan a frequency range using a narrow filter. FFT-based analyzers calculate the spectrum from digitized signals, while real-time analyzers continuously process signals within their specified analysis bandwidth.
- Four settings shape most initial measurements: span, resolution bandwidth (RBW), reference level, and input attenuation. State the RBW with every noise reading.
- A spectrum analyzer measures a signal's frequency content. To measure how a component responds to an applied signal, including its phase response, use a vector network analyzer (VNA) such as the used Keysight E5071C, which offers frequency coverage up to 20 GHz.
What Is a Spectrum Analyzer?
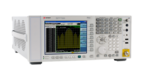
A spectrum analyzer shows the frequencies present in an electronic signal and measures their levels. While an oscilloscope displays how a signal changes over time, a spectrum analyzer helps you identify frequency components such as harmonics and unwanted signals. Engineers use it for radio frequency (RF) testing and diagnosing electromagnetic interference (EMI).
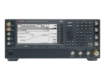
Many modern signal analyzers combine traditional spectrum measurements with more advanced capabilities, such as analyzing complex or modulated signals, depending on their installed software and options. This guide uses "spectrum analyzer" to refer to both.
A spectrum analyzer typically measures signals without supplying its own test stimulus. Some models include an optional tracking generator for basic magnitude-only response measurements. To measure a component's response, including both magnitude and phase, a vector network (VNA) is generally the better choice. The used Keysight E5071C offers frequency coverage up to 20 GHz, while Keysight recommends the E5080B for new purchases.
How Does a Spectrum Analyzer Work?
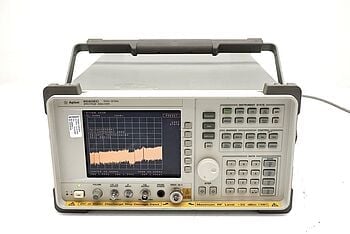
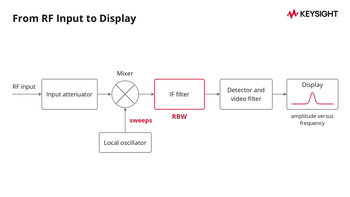
A swept-tuned spectrum analyzer scans a range of frequencies and measures the signal level at each one, creating a display of amplitude versus frequency. Keysight's guide How Does a Spectrum Analyzer Work? explains the mixer and detector stages. The main stages are:
- Input attenuator: Reduces the signal level before it reaches the input mixer.
- Mixer and local oscillator (LO): The local oscillator produces a signal that mixes with the incoming signal, converting selected frequency components to an intermediate frequency (IF). As the LO sweeps, different frequency components pass through the IF stage.
- IF filter: Passes a narrow band of frequencies. The filter's width determines the resolution bandwidth (RBW).
- Detector and video filter: The detector measures the level of the filtered signal, while the video filter can smooth the displayed trace.
- Display: Shows the measured signal level against frequency.
What Are the Types of Spectrum Analyzers?
The right type depends on the signals you need to see. Frequency range varies by model, so check the data sheet for the analyzer you're considering.
1. Swept-Tuned Spectrum Analyzers
Swept-tuned analyzers are the traditional design. The local oscillator (LO) sweeps so the analyzer tunes across the selected frequency span, while the intermediate frequency (IF) filter determines the resolution bandwidth. Newer swept analyzers use digital signal processing, so check the data sheet for how a given model works.
- Simple signal path: The block diagram above shows the main stages from input to display.
- One narrow band at a time: At any instant the analyzer measures only the narrow band it is tuned to, so a short event elsewhere in the span can be missed.
- Resolution depends on the filter: Closely spaced signals need a narrow RBW, which slows the sweep.
2. Digital Spectrum Analyzers
Digital spectrum analyzers convert incoming signals into digital data for processing. A common method is the Fast Fourier Transform (FFT), which calculates the spectrum of a captured time-domain signal.
- Whole band at once: An FFT analyzer can compute many frequencies from one capture instead of stepping through them one at a time.
- Vector signal analyzers: With vector analysis software, a signal analyzer can examine complex signals, such as modulated carriers.
3. Real-Time Spectrum Analyzers
A swept-tuned analyzer measures one narrow band at a time, so it can miss what happens elsewhere in the span. A real-time spectrum analyzer processes every sample within a stated bandwidth without gaps. Keysight's 89600B help describes a swept-tuned analyzer as displaying results sequentially and a real-time analyzer as displaying the energy at all frequency components simultaneously.
- Short events: Useful for intermittent interference and signal bursts that can be shorter than a sweep.
- Limits: The analysis bandwidth and the shortest event the analyzer can show depend on the model, so read the specification for the one you plan to use.
How the Three Types Compare
| Type | How it measures | Strength | Limit |
|---|---|---|---|
| Swept-tuned | Sweeps the span past a narrow IF filter | Simple signal path | Sees one narrow band at a time |
| Digital (FFT-based) | Digitizes the signal and calculates the spectrum | Can compute a whole band from one capture | Captures are bounded by the analysis bandwidth |
| Real-time | Processes every sample in a stated bandwidth without gaps | Short events inside the bandwidth | Analysis bandwidth depends on the model |
Type
How it measures
Strength
Limit
Swept-tuned
Title
Simple signal path
Simple signal path
Title
Sees one narrow band at a time
Sees one narrow band at a time
Digital (FFT-based)
Title
Digitizes the signal and calculates the spectrum
Digitizes the signal and calculates the spectrum
Title
Can compute a whole band from one capture
Can compute a whole band from one capture
Title
Captures are bounded by the analysis bandwidth
Captures are bounded by the analysis bandwidth
Real-time
Title
Processes every sample in a stated bandwidth without gaps
Processes every sample in a stated bandwidth without gaps
Title
Short events inside the bandwidth
Short events inside the bandwidth
Title
Analysis bandwidth depends on the model
Analysis bandwidth depends on the model
What Can a Spectrum Analyzer Measure?
A spectrum analyzer measures the frequency and amplitude of signals within a selected span. You can use it to identify harmonics and spurious signals, examine the noise floor, and evaluate signal quality. Each reading depends on the settings, so write down the span, RBW, and attenuation with the result.
Dynamic range describes the difference in level between the strongest and weakest signals an analyzer can measure simultaneously. The available dynamic range depends on the model and its specifications. For a component's frequency response with phase, you need a vector network analyzer.
How Do You Use a Spectrum Analyzer? Step-by-Step Guide
These 7 steps walk you through setting up a spectrum analyzer and interpreting the results. Start with the 4 settings that have the greatest impact on your measurements.
| Setting | What it does | Trade-off |
|---|---|---|
| Span | Sets the start-to-stop frequency range | A wide span shows more but with less detail |
| RBW | Sets the IF filter width | A narrow RBW separates close signals and lowers the displayed noise, but slows the sweep |
| Reference level | Sets the level at the top of the display | Set it so the largest expected signal fits on screen |
| Input attenuation | Reduces the level at the input mixer | More attenuation helps prevent distortion but raises the displayed noise floor |
Setting
What it does
Trade-off
Span
Title
Sets the start-to-stop frequency range
Sets the start-to-stop frequency range
Title
A wide span shows more but with less detail
A wide span shows more but with less detail
RBW
Title
Sets the IF filter width
Sets the IF filter width
Title
A narrow RBW separates close signals and lowers the displayed noise, but slows the sweep
A narrow RBW separates close signals and lowers the displayed noise, but slows the sweep
Reference level
Title
Sets the level at the top of the display
Sets the level at the top of the display
Title
Set it so the largest expected signal fits on screen
Set it so the largest expected signal fits on screen
Input attenuation
Title
Reduces the level at the input mixer
Reduces the level at the input mixer
Title
More attenuation helps prevent distortion but raises the displayed noise floor
More attenuation helps prevent distortion but raises the displayed noise floor
1. Connect the Signal
- Use a cable rated for the range: Connect the signal source to the RF input using a coaxial cable rated for the frequencies you are measuring.
- Respect the input limit: Never exceed the maximum input level on the data sheet.
2. Set the Frequency Range
- Know the expected frequency: This guides the start and stop frequencies, or a center frequency and span. The span is the difference between start and stop.
- Start wide, then narrow: A wide span helps you locate signals across the frequency range, while a narrower span lets you examine individual peaks in more detail.
3. Adjust the Resolution Bandwidth (RBW)
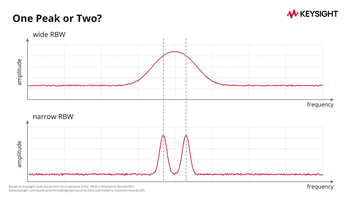
- Understand RBW: Resolution bandwidth is the width of the IF filter. A narrower RBW separates closely spaced signals and lowers the displayed noise floor, but slows the sweep.
- Match the RBW to the task: Use a narrow RBW for close signals and a wide one for a quick overview. Thermal noise power is proportional to bandwidth, so doubling the RBW generally raises the displayed noise floor by approximately 3 dB. A University of British Columbia course note explains how an RBW that is too wide can prevent the analyzer from distinguishing closely spaced signals and increase the noise included in the measurement.
4. Set the Reference Level and Attenuation
- Reference level: Sets the level at the top of the display. Adjust it so the largest expected signal fits on the screen.
- Attenuation: Reducing the signal amplitude can prevent distortion and saturation. Set it by hand or use the automatic setting if your analyzer has one. A 2020 Keysight blog describes the input mixer level as a trade-off between distortion performance and noise sensitivity.
5. Analyze the Signal
- Read the peaks: Start with the expected signal. Peaks indicate energy at particular frequencies.
- Find the noise floor: Look at the baseline between signal peaks to estimate the displayed noise floor. Record the RBW with your measurement.
- Use markers: Place a marker on a peak to read its frequency and amplitude.
- Compare with what you expect: An unexpected peak or level can point to distortion, interference, or a setup error.
6. Apply Advanced Analysis (Optional)
- Harmonics and spurious signals: Harmonics appear at integer multiples of the fundamental. Keysight's EMI testing page describes using a signal analyzer or EMI receiver to troubleshoot and identify suspected disturbances.
- Noise measurement: Examine a frequency range without expected signals. Record the RBW so the noise reading can be interpreted correctly.
- Demodulation: Some analyzers can demodulate modulated signals to analyze their content.
7. Save and Review the Results
- Capture the display: Save the trace as an image or data file for documentation or review.
- Annotate your results: Label key features so they are easy to recall.
- Review the data: Check whether the results match your expectations and note any measurements that need further investigation.
Accuracy depends on the instrument model and its calibration, so read the data sheet for the figures that matter to your measurement.
Frequently Asked Questions
A spectrum analyzer measures the amplitude of a signal at each frequency across a chosen span. That shows the signal's frequency components, including harmonics and noise.
An oscilloscope shows a signal's amplitude against time. A spectrum analyzer shows amplitude against frequency.
A spectrum analyzer measures an existing signal and typically has no built-in source. A vector network analyzer (VNA) supplies its own stimulus and reports amplitude and phase, so it shows how a component responds.
Resolution bandwidth (RBW) is the width of the IF filter. A narrower RBW separates closely spaced signals and lowers the displayed noise floor, but slows the sweep.
Need Tech Support?
Not sure which model fits your application? Talk to our technical support team and they will help you choose.
Browse Used Spectrum and Signal Analyzers
Start with the highest frequency you need to measure, then compare the noise floor and installed options in each data sheet before you pick a model.
Whenever You’re Ready, Here Are
5 Ways We Can Help You
1
Browse our used spectrum and signal analyzers
2
Call tech support US: +1 800 829-4444
Press #, then 2. Hours: 7am – 5pm MT, Mon– Fri
3
Contact our sales support team
4
Create an account to get price alerts and access to exclusive waitlists
5
Talk to your account manager about your specific needs
Sources
- Keysight Used Equipment Store, How Does a Spectrum Analyzer Work?: the local oscillator, mixing, filter, and detector stages.
- Keysight Used Equipment Store, Network Analyzer Versus Spectrum Analyzer: a spectrum analyzer is a tuned receiver, typically without a built-in source; some mo
- Keysight Used Equipment Store, What Is Resolution Bandwidth?: the IF filter bandwidth, separation of close signals, and the noise floor.
- Keysight Used Equipment Store, How to Read a Spectrum Analyzer Like a Pro: reducing the signal amplitude to prevent distort
- Keysight Technologies, E5071C Network Analyzer, E5092A Configurable Multiport Test Set, configuration guide 5989-5480: Keysight recommends the E5080B for new product
- ScienceDirect, Electromagnetic Interference: the EMI definition.
- Wikipedia, Fast Fourier Transform: the algorithm.
- EverythingRF, What Are Spurious and Harmonics Signals?: harmonics at integer multiples of the fundamental.
- Keysight 89600B help, Different Types of Spectrum Analyzers: swept-tuned and real-time analyzers; newer analyzers use digital signal processing.
- University of British Columbia, ELEC 391, Sweep and Bandwidth Considerations (2018): the effect of resolution bandwidth on separation and noise, thermal noise N = kTB, and a 3 dB rise in the noise fl
- Keysight, How to Optimize Mixer Input Level of Signal Analyzer for Better Signal Analysis (2020): the mixer-level t
- Keysight, How to Conduct Electromagnetic Interference (EMI) Testing: signal analyzers and EMI receivers for troubleshooting disturbances.