What are you looking for?
Who uses Thermal Design (HeatWave)?
Below are illustrations of typical HeatWave applications. For more detailed information, refer to HeatWave Technical Papers and HeatWave Case Studies.
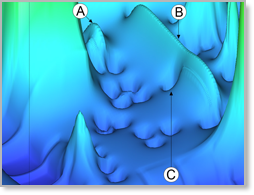
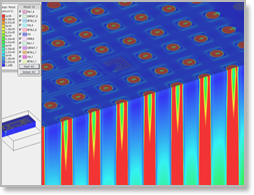
Temperatures within a 3DIC, resolving transistor and TSV details
The surface height and color represent the temperature in the channel layer of the top die. Notice the temperature peaks at the active devices, and the temperature troughs at the bonding pads and TSVs. The peaks and troughs are at the length-scales of these design features.
An enlarged view. Arrow A indicates a row of transistors with the expected smooth temperature profile, higher temperature in the middle. Arrow B indicates a longer row lacking the expected smooth temperature profile, due to the cooling effect of the TSVs at Arrow C.

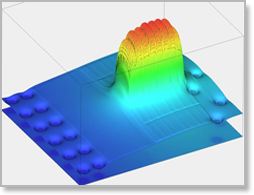
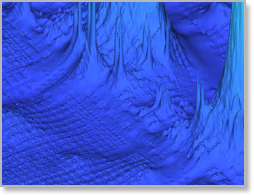
Temperature in an RF antenna-switch chip, within a cell phone
The surface height and color show the temperature profile of the active channel in an RF antenna switch.
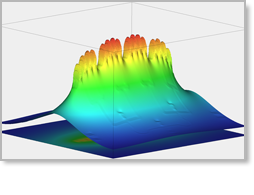
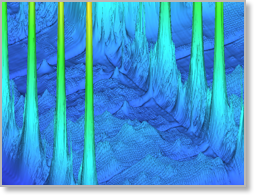
Temperature throughout a HEMT (High-electron-mobility transistor) power amplifier
The profile of four groups, each containing several individual gates, is evident. The central groups are hotter, as are central gates within each group.
The channel comprises a conductive plane termed a two-dimensional electron gas (2DEG), whose mobility decreases with temperature. Hence obtaining an accurate vertical temperature profile as seen here, can be critical.
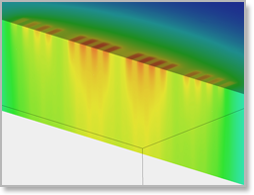
Detailed view of heat transport in an array of TSVs in a two-tier 3D IC test chip. The heat source is located above the TSV array.
- The color indicates the heat flux magnitude through each TSV.
- Heat generated above the surface of this plot of heat-flux-magnitude, flows down through the intervening dielectric into the array of TSVs. No heat is generated in any of the TSVs.
- TSVs further from the center of the array have a notably asymmetric heat-flux profile.
Temperature in the central signal-processing tier of a three-tier 3D IC
- The temperature peaks due to strong clock buffers are dominant.
- The effects of heat-transport through wires and rows of TSVs are evident.
- A more detailed view of temperature variations due to individual layout features, including TSVs, and the effects of heat-sources on adjacent layers and tiers.

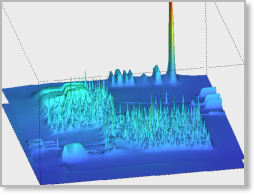
Temperature in a mixed signal IC
The surface height and color represent the temperature. A power transistor produces the large temperature peak at rear. Blocks of digital logic contribute to the transistor-scale temperature peaks in the central area.
HeatWave Overview Demo (~ 3 minutes)
Thermal effects are becoming a larger challenge for IC designers. Circuit simulators can incorporate temperature but this variable is usually assumed constant. You can now temperature-enable your circuit simulation by using HeatWave to perform accurate electrothermal analysis.
Watch this short video on YouTube.

Time Varying Temperature Risks Demo (~ 1 minute)
As power transistors turn on and off, time varying hot spots can affect sensitive analog circuitry. HeatWave provides transient electrothermal analysis so you can detect potential thermal problems early in your IC design.
Watch this short video on YouTube.

Uniform Temperature Assumption Risks Demo (~ 1 minute)
Assuming uniform temperature across the IC during circuit simulation leads to inaccurate results. With HeatWave you can now analyze how temperature variations between devices affect IC performance.
Watch this short video on YouTube.
Temperature Enable Your Simulator Demo (~ 1 minute)
Time-varying temperature impacts IC performance, and if not modeled properly, leads to inaccurate circuit simulations and IC re-spins. Transient electrothermal analysis with HeatWave allows you to detect thermal problems early in your IC design.
Watch this short video on YouTube.

Learn more about Thermal Design (HeatWave) Electro-Thermal Analysis Software.