Keysight Oscilloscope Glossary
What Is Trace in Oscilloscopes?


Introduction
Did you know that the term "trace" in oscilloscopes originated from the days when phosphor screens displayed the waveform, creating a visual trace?
Even in today's digital age, understanding what a trace is and how to analyze it remains a cornerstone of electrical engineering work involving oscilloscopes.
Whether you're debugging a circuit or analyzing signal integrity, a deeper understanding of traces can significantly elevate your work.
What is a Trace?
A trace serves as a graphical representation of an electrical signal against time or another relevant parameter, displayed on an oscilloscope screen. In essence, it "traces" the behavior of a signal.
Components of a Trace
A typical trace consists of the following elements:
- Amplitude: Represents the voltage level.
- Time: Horizontal axis showing the time domain.
- Trigger point: A specified voltage or time event that starts the trace.
Key Takeaway
Understanding the intricacies of traces in oscilloscopes is essential for accurate signal analysis and effective troubleshooting. Mastering different types of traces, calibration techniques, and advanced features like signal processing can significantly enhance your diagnostic and testing capabilities.
Types of Traces
Understanding the various types of traces in an oscilloscope empowers engineers to select the most suitable mode for a given application. Let's delve into four common types of traces: Single Trace, Dual Trace, Math Trace, and XY Trace.
Single Trace
A single trace displays one waveform derived from a single input channel. This is the most straightforward type of trace and is often the starting point for many diagnostic activities.
Applications
- Basic troubleshooting
- Signal integrity checks
- Time-domain measurements
Advantages
- Simplified view for quick diagnosis
- Easy to set up and calibrate
- Ideal for less complex signal structures
Limitations
- Can’t compare multiple signals simultaneously
- Limited in analyzing interactions between channels
Dual Trace
Dual trace enables the simultaneous display of two waveforms, each coming from separate input channels. This capability is crucial for comparative analyses and for studying signal interactions.
Applications
- Phase comparison
- Differential measurements
- Simultaneous monitoring of input and output signals
Advantages
- Enables direct signal comparison
- Useful for cause-and-effect analysis
- Saves time by showing two signals simultaneously
Limitations
- May require more complex triggering setups
- Risk of display clutter with intricate waveforms
Math Trace
A math trace doesn't rely solely on direct input but calculates and displays a waveform based on a mathematical operation or function applied to one or more input channels.
Applications
- Signal filtering
- Complex computations like Fourier transforms
- Creating derived parameters for analysis
Advantages
- Offers advanced analysis capabilities
- Allows custom equations for specific needs
- Enables investigation of signals in the frequency domain
Limitations
- May require familiarity with mathematical functions
- Potential for computational errors if incorrectly set up
XY Trace
In XY trace mode, the oscilloscope plots one channel's voltage against another channel's voltage, as opposed to plotting against time. This results in a Lissajous figure and is useful for phase and harmonic analysis.
Applications
- Phase relationship studies
- Harmonic distortion analysis
- Quality control for signal generators
Advantages
- Provides a quick view of phase relationships
- Allows detailed harmonic analysis
- Useful for specialized tests like hysteresis loop characterization
Limitations
- Lacks time-domain information
- May require expertise for correct interpretation
By understanding these four main types of traces, you can more effectively choose the right oscilloscope settings for your specific engineering tasks. Each type offers unique advantages and limitations that can greatly impact the success of your measurement and analysis.
How to Read a Trace
Accurately reading and interpreting a trace is an essential skill for electrical engineers and professionals using oscilloscopes.
This section will expand on crucial steps such as calibration, identifying key points, and utilizing cursors for precise measurements.
Calibration
Calibration ensures that the oscilloscope accurately measures and displays electrical signals. Minor drifts in the device's internal components over time can cause inaccurate readings, so regular calibration is necessary.
Steps for Calibration
- Connect a calibration signal to the oscilloscope's input.
- Follow the oscilloscope’s calibration procedure, which usually involves adjusting gain and offset settings.
- Confirm that the displayed trace accurately represents the calibration signal.
Common Calibration Errors
- Incorrect probe attenuation
- Mismatch between the oscilloscope and probe impedance
Identifying Key Points
Zero Level
The zero level serves as the midpoint around which the waveform oscillates. It represents the "zero voltage" point and is crucial for determining the signal's amplitude and other metrics.
Peak Levels
Peak levels are the highest and lowest points the waveform reaches. Understanding peak levels helps you:
- Evaluate signal strength
- Detect potential clipping or saturation in the circuit
- Determine the operating voltage range
Cycle
A cycle refers to one complete oscillation of the waveform. Recognizing the start and end points of a cycle helps you to:
- Calculate the frequency of the signal
- Assess periodicity and stability
- Analyze any irregularities like jitter or noise
Utilizing Cursors
Cursors are graphical lines or markers that you can position on the trace for precise measurements. Modern oscilloscopes usually offer both horizontal and vertical cursors.
How to Use Cursors
- Activate the cursor function on your oscilloscope.
- Position the cursors at desired points on the trace.
- Read the measurement results, usually displayed on the side or bottom of the screen.
Benefits of Using Cursors
- Facilitate exact measurements like rise time, fall time, and pulse width.
- Enable delta measurements between two points, useful for phase and timing differences.
- Simplify capturing and recording specific trace values for further analysis.
By mastering the steps of calibration, key point identification, and cursor utilization, you can ensure that you're reading traces accurately and obtaining meaningful data from your measurements. These skills are fundamental for anyone aiming to excel in tasks involving oscilloscopes.
Common Trace Artifacts
| Artifact | Cause | Solution |
|---|---|---|
| Noise | External interference | Use shielding or filters |
| Jitter | Timing inconsistencies | Increase sampling rate (in digital oscilloscopes) |
| Ghosting | Residual phosphor glow (in analog oscilloscopes) | Adjust persistence settings |
Tips for Analyzing Traces
Accurate and insightful trace analysis can make or break your work with oscilloscopes. Whether you're troubleshooting a faulty circuit or studying intricate signal behaviors, effective trace analysis techniques can greatly enhance your understanding. Here's a deeper look into some key tips for optimal trace analysis.
Use Appropriate Scaling
The vertical and horizontal scales are fundamental to how well you can visualize and interpret a trace. Incorrect scaling can lead to misinterpretation of the signal's characteristics.
Steps for Optimal Scaling
- Adjust the vertical scale to fit the trace within the screen, maximizing the trace amplitude without clipping.
- Set the horizontal scale to display at least one full cycle of the waveform, if applicable.
Consequences of Poor Scaling
- Clipped peaks: Obscure the real amplitude of the signal.
- Over-compressed trace: Makes it difficult to observe vital details.
Apply Signal Processing
Many modern oscilloscopes come with built-in signal processing features like filtering, averaging, and Fast Fourier Transform (FFT).
How to Apply FFT
- Select the FFT function in the menu.
- Choose the appropriate window function (Hanning, Blackman, etc.).
- Observe the frequency components displayed alongside or over the time-domain trace.
Benefits of Signal Processing
- Uncover hidden signal characteristics: Signal processing can reveal aspects not visible in the time-domain view.
- Reduce noise: Tools like averaging can help in eliminating random noise, offering a cleaner signal for analysis.
Check Trigger Settings
The trigger settings define the point at which the oscilloscope starts capturing the waveform. Incorrect triggering can lead to unstable or misleading traces.
Common Trigger Types
- Edge triggering: Initiates the trace when the signal crosses a specified voltage level.
- Pulse triggering: Starts the trace based on the duration of a pulse.
- Frequency triggering: Activates the trace capture at a particular frequency.
Tips for Correct Triggering
- Use auto-trigger for stable, repetitive signals.
- Opt for normal or single-shot triggering for non-repetitive or complex signals.
By giving proper attention to scaling, utilizing signal processing features, and scrutinizing your trigger settings, you can vastly improve the quality and reliability of your trace analysis.
These best practices help you extract maximum information from the oscilloscope traces, making your testing and diagnostic tasks more accurate and insightful.
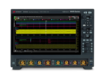
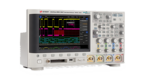
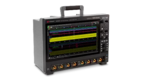
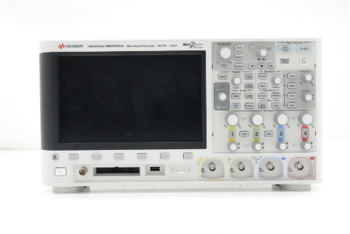
Select up to 3 instruments to compare
Conclusion
Traces are the heart of oscilloscope analysis, offering a detailed visual snapshot of electrical signals in action. They serve as a crucial tool for engineers in a myriad of applications—from simple troubleshooting to complex signal behavior studies.
By mastering techniques like proper scaling, signal processing, and triggering, professionals can unlock the full potential of their oscilloscopes.
Understanding the nuances of different types of traces and how to read them accurately elevates the quality of your work and leads to more meaningful insights.
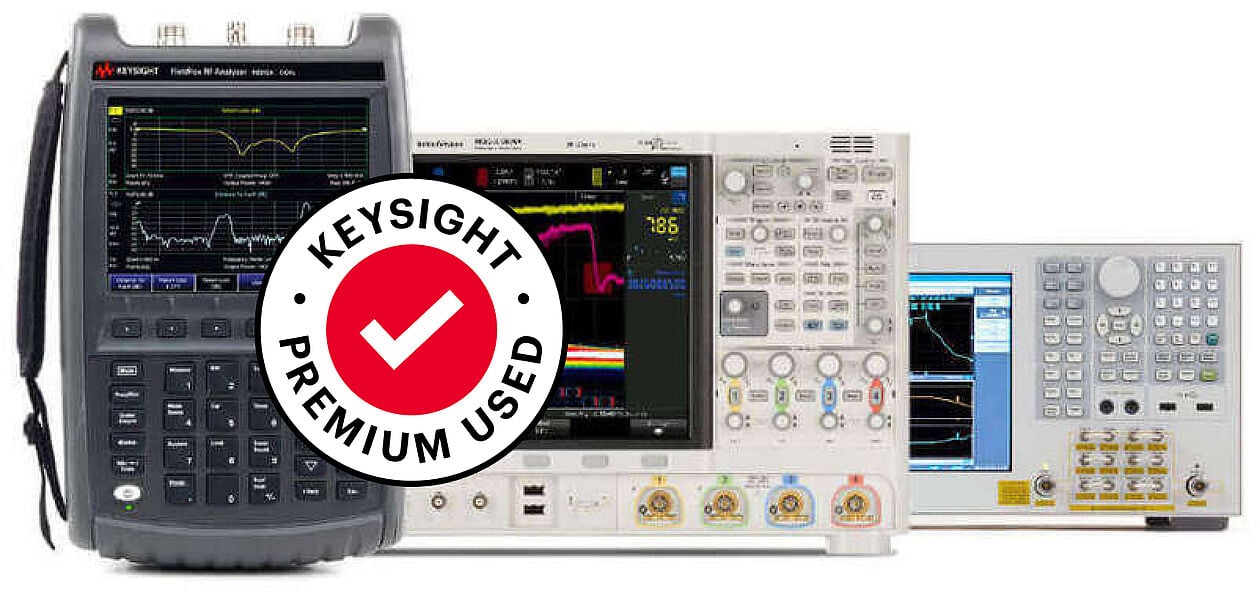
If you're looking to upgrade your testing setup, consider the Keysight Used Equipment Store for premium used oscilloscopes, spectrum analyzers, waveform generators, and multimeters.
Get top-of-the-line equipment that meets your exacting standards, without breaking the bank. Elevate your trace analysis and overall testing capabilities today!
Whenever You’re Ready, Here Are
5 Ways We Can Help You
Browse our Premium Used Oscilloscopes,
Call tech support US: +1 800 829-4444
Press #, then 2. Hours: 7am – 5pm MT, Mon– Fri
Contact our sales support team
Create an account to get price alerts and access to exclusive waitlists
Talk to your account manager about your specific needs.