
Bode Plots and Frequency Response Measurements
Posters
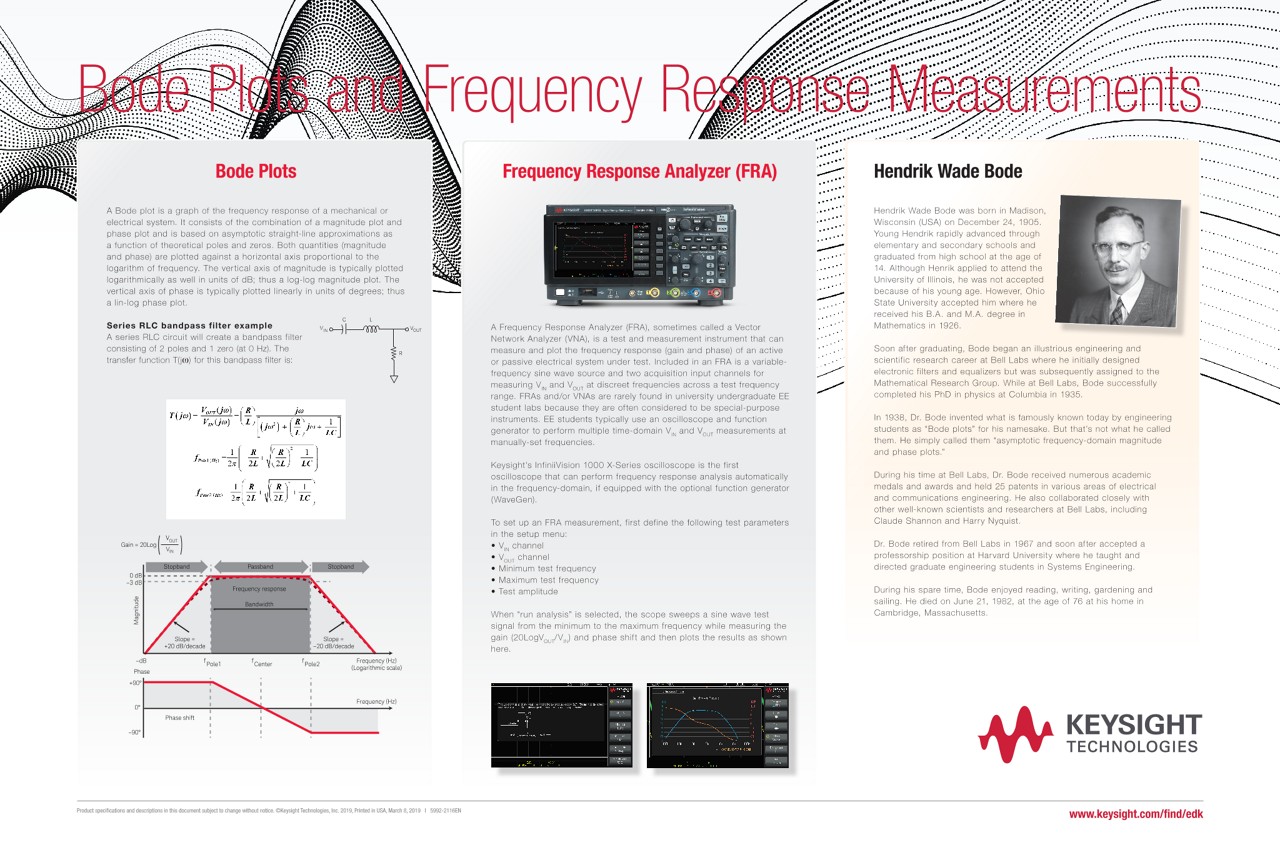
Bode Plots
A Bode plot is a graph of the frequency response of a mechanical or electrical system. It consists of the combination of a magnitude plot and phase plot and is based on asymptotic straight-line approximations as a function of theoretical poles and zeros. Both quantities (magnitude and phase) are plotted against a horizontal axis proportional to the logarithm of frequency. The vertical axis of magnitude is typically plotted logarithmically as well in units of dB; thus a log-log magnitude plot. The vertical axis of phase is typically plotted linearly in units of degrees; thus a lin-log phase plot.