FieldFox Vector Network Analysis
Demos
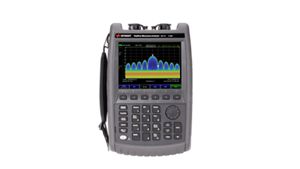
This video demonstrates how to use a FieldFox handheld RF and microwave analyzer to perform two-port vector network analysis on an RF device. Vector network analysis enables engineers and technicians to characterize how a component or network transmits and reflects RF energy across a selected frequency range. These measurements are essential for evaluating components such as filters, amplifiers, cables, antennas, and other devices used in RF and microwave systems.
The demonstration begins by configuring FieldFox for network-analyzer operation and preparing the instrument for a two-port measurement. A two-port calibration is performed to establish accurate measurement reference planes and remove the systematic effects of cables, adapters, and connections from the results. Proper calibration is an important part of vector network analysis because it improves measurement accuracy and ensures that the displayed response represents the device under test as closely as possible.
After calibration, the video introduces the four fundamental two-port scattering parameters, commonly known as S-parameters. The input reflection coefficient, S11, indicates how much RF energy is reflected at the input of the device. The forward transmission coefficient, S21, shows how a signal passes from port 1 to port 2. The reverse transmission coefficient, S12, measures signal transmission in the opposite direction, from port 2 to port 1. The output reflection coefficient, S22, indicates how much energy is reflected at the device’s output.
The demonstration first examines the forward transmission response over a broad frequency range. The frequency range is then adjusted to focus on the device’s primary response between approximately 1.9 and 2.4 GHz. This narrower view makes it easier to examine the shape and performance of the measured passband. FieldFox displays the S21 response in logarithmic magnitude, allowing the user to see the device’s insertion loss and attenuation across frequency.
Bandwidth analysis is then applied to the transmission response. The analyzer automatically identifies important characteristics of the measured signal, including the center frequency, left and right bandwidth limits, insertion loss, bandwidth, and quality factor. In the demonstrated measurement, the device exhibits a center frequency near 2.133 GHz, a bandwidth of approximately 84.7 MHz, an insertion loss of about 3.8 dB, and a quality factor of approximately 25.2. These automated calculations help users characterize device performance without manually determining each value from the trace.
The video also demonstrates how measurement data can be viewed in different formats. In addition to logarithmic-magnitude traces, FieldFox can present results using formats such as the Smith chart and linear magnitude. A Smith chart provides a graphical representation of complex impedance or reflection behavior, helping users evaluate how well a device is matched across the measured frequency range. Changing the display format allows engineers to analyze the same S-parameter data from different perspectives.
Markers are used throughout the demonstration to identify specific frequencies and measurement values. The marker-search and bandwidth functions allow users to quickly locate the center of the response, the band edges, and other points of interest. These capabilities simplify the process of comparing measured performance with design targets or acceptance criteria.
The final portion of the video shows all four S-parameters displayed simultaneously. This multi-trace view provides a complete picture of the device’s forward transmission, reverse transmission, input reflection, and output reflection within a single screen. Coupled markers align the measurements at common frequencies, making it easier to compare how the device behaves at its center frequency and bandwidth limits.
This demonstration is intended for RF and microwave engineers, field technicians, maintenance teams, and other professionals who need to characterize RF components outside a traditional laboratory. By combining two-port calibration, S-parameter measurements, automated bandwidth analysis, marker tools, multiple display formats, and a portable form factor, FieldFox enables comprehensive vector network analysis at the point of need. The video illustrates a practical workflow for setting up a measurement, analyzing a two-port RF device, and interpreting the results required to verify performance and troubleshoot RF systems.