
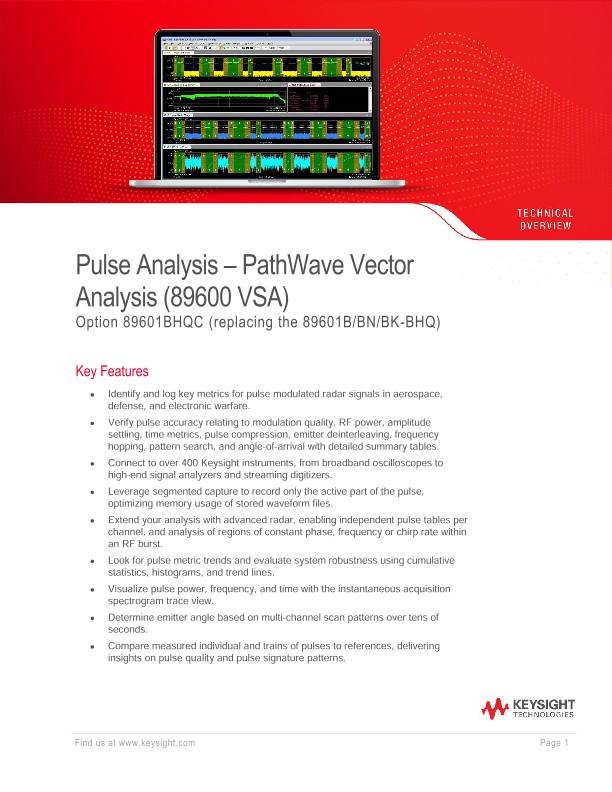
Pulse Analysis – PathWave Vector Analysis (89600 VSA)
Technical Overviews
Key Features
• Identify and log key metrics for pulse modulated radar signals in aerospace, defense, and electronic warfare.
• Verify pulse accuracy relating to modulation quality, RF power, amplitude settling, time metrics, pulse compression, emitter deinterleaving, frequency hopping, pattern search, and angle-of-arrival with detailed summary tables.
• Connect to over 400 Keysight instruments, from broadband oscilloscopes to high-end signal analyzers and streaming digitizers.
• Leverage segmented capture to record only the active part of the pulse, optimizing memory usage of stored waveform files.
• Extend your analysis with advanced radar, enabling independent pulse tables per channel, and analysis of regions of constant phase, frequency or chirp rate within an RF burst.
• Look for pulse metric trends and evaluate system robustness using cumulative statistics, histograms, and trend lines.
• Visualize pulse power, frequency, and time with the instantaneous acquisition spectrogram trace view.
• Determine emitter angle based on multi-channel scan patterns over tens of seconds.
• Compare measured individual and trains of pulses to references, delivering insights on pulse quality and pulse signature patterns.
The Problem Statement
For military radar engineers, radar is all about protecting the men and women that may be stepping into harm’s way. For air and ground traffic control, radar is about safety. For scientists, radar is about collecting data on natural phenomena and planetary systems. Clearly, the applications for radar are vast, and for EW, the implications of failure can be dire. The technology has evolved enormously since World War II when radar was first taken seriously. Teams from around the world are working to improve radar system speed, resolution, and accuracy in the face of noise and even in the presence of hostile electromagnetic environments. Today, electronic warfare systems are required to identify targets and signals quickly to provide appropriate responses in a very dynamic environment. Pulses are now modulated with multiple types of modulation to improve range resolution, with frequencies hopping rapidly to avoid detection. Pulse amplitudes must rise and fall with prescribed envelopes. Our measurement systems and analytical tools need to keep up. Radar systems teams will collect RF and microwave signal data across broad swaths of frequency using the latest instrumentation hardware. From the complex IQ data, individual pulses need to be identified, quantified, and validated. Was the transmitter working as expected? Why did the system drop a pulse? Was the linear ramp in frequency across the pulse width indeed linear? Across many thousands of pulses, what was the statistical distribution of pulse width? What is the trend in pulse repetition interval? Fortunately, Keysight’s PathWave Vector Signal Analysis (89600 VSA) software adds a pulse analysis option that enables answers to these questions. Accurate and timely analyses are of the utmost importance for radar and EW missions.
Explore Your Signal Vector Mode
Even with basic VSA (89601200C), one can learn much about their signal in Vector mode, which enables time domain and frequency domain visualizations On the left, we see time domain and frequency domain representations of the chirp signal. To the right, we see a spectrogram view that moves synchronously with the graphs on the left. Using markers, one can measure the chirp start and stop frequencies along with relevant timing information.
Now Add Radar Pulse Analysis (option 89601BHQC)
With the radar pulse analysis measurement extension, pulse boundaries are automatically detected with advanced algorithms. A Swiss Army knife of tools becomes available, including new trace types, statistics, measurements and table metrics, all specifically tailored for pulse analysis.
Trace Types - Here we show instantaneous frequency and instantaneous phase versus time. Furthermore, based on a best fit analysis of instantaneous frequency, deviations from the best fit are plotted as “FM Error vs Time.”
Statistics - Any metric that may be tabulated in a pulse table may be analyzed in terms of its statistics and trendlines. In this case, the amplitude envelope overshoot is plotted as a histogram. This way, RF system engineers can answer the question "how accurate and repeatable were my pulses?”
Measurements - Certain workflows require specialized measurements. Some examples include the analysis of pulse sidelobes and pulse compression; angle of arrival; or even pulse pattern search. In this illustration, we present various pulse trains that have been recognized and color-coded appropriately.
All three elements (trace types, statistics, and measurements) are shown above with highly configurable windows. Four pulses (4 through 7) are highlighted and aligned with their corresponding time domain traces. A histogram of the risetime, trend line of the pulse fall time and an overall pulse summary are also included. Along the bottom, detailed pulse metrics are tabulated across the 40 pulses detected.
How Accurate and Repeatable were my Pulses?
Since pulses may span many gigahertz of frequency, large data sets must be analyzed to identify individual pulses and quantify various figures of merit. With the 89601BHQC, pulses are automatically identified, labeled, and cataloged in pulse tables.
Numerous other metrics are available, and these are organized in the following categories.
• Modulation Metrics – modulation type, modulation code number, chip count, measured bits, chip width, chip offset
• RF Output Level Metrics – top level, base level, top to base ratio, amplitude when pulse is on, peak level, mean level, peak to average ratio
• Amplitude Settling Metrics – pulse droop, droop rate, droop starting amplitude, droop ending amplitude, overshoot, ripple
• Time Metrics – rise time, fall time, rising edge, falling edge, width, duty cycle, pulse repetition frequency, pulse repetition interval, off time
• Frequency Metrics - mean frequency, pulse to first pulse frequency difference, peak-to-peakfrequency deviation, and relative to an estimated reference signal, RMS frequency error, peak frequency error and time location of peak frequency error
• Phase Metrics – mean phase, pulse to first pulse phase difference, peak to peak phase deviation,and relative to an estimated reference signal, RMS phase error, peak phase error and time location of peak phase error
• Linear Frequency Modulation Metrics – best fit mean modulation frequency, best fit start modulation frequency, best fit ending modulation frequency, best fit peak-to-peak modulation frequency deviation, best fit FM slope, integrated nonlinearity from best fit
• Triangular Frequency Modulation Metrics – best fit apex frequency, best fit apex time
• Channel to Channel Difference Metrics – time, amplitude, and frequency difference of corresponding pulse on channel 2 as compared to Channel 1
• Pulse Compression Metrics (when enabled) – correlation between reference pulse and measured pulse; peak sidelobe level, peak sidelobe location, compression ratio, main lobe width
• Deinterleaving Metrics (when enabled) – emitter ID
• Frequency Hopping Metrics (when enabled) – hop state index, hop begin time, hop ending time, hop settling time, hop dwell time, hop switching time, hop mean frequency, hop mean frequency deviation
• Non-linear FM Metrics (when enabled) – polynomial coefficients describing frequency vs time.