

Title
Spectrum analyzer
Keysight Oscilloscope Glossary
What Is Spectrum Analysis?

Introduction
Spectrum analysis, also known as spectral analysis, breaks a signal down into its individual frequencies and shows how strong each one is. The results appear on a graph called a spectrum, making it easier to identify signal components, harmonics, and interference.
The accuracy of a spectrum measurement depends on more than the analysis method. Settings such as sample rate and capture length also affect what you can detect and how precisely you can measure it.
Overview
- Spectrum analyzers are designed to measure signal levels across a range of frequencies. Oscilloscopes with FFT capabilities can also display a basic spectrum.
- Capture settings affect frequency resolution. With an FFT, the sample rate and record length determine the spacing between frequency bins, which influences how well closely spaced signals can be distinguished.
- Component response requires a different measurement. A network analyzer measures how a component responds across frequency. The used Keysight E5071C supports frequencies up to 20 GHz. Keysight has discontinued this model, as noted in its data sheet, and recommends the E5080B for new purchases.
What Is Spectrum Analysis?
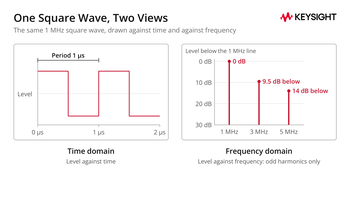
An oscilloscope displays how a signal changes over time. Spectrum analysis reveals the individual frequency components that make up that signal. A 1 MHz square wave, for example, shows up as a strong line at 1 MHz and smaller lines at 3 MHz, 5 MHz, and so on up through the odd multiples. The ideal square wave contains only odd harmonics, and their amplitudes fall as 1/n, so the line at 3 MHz sits about 9.5 dB below the fundamental and the line at 5 MHz about 14 dB below it.
In the time domain, harmonics, interference, and noise appear together in the waveform, making individual frequency components harder to identify.
Why Is Spectrum Analysis Essential?
- Identifying signal interference: In wireless communication, spectrum analysis helps identify and reduce interference from other signals.
- Quality assessment: For audio and video broadcasts, spectrum analysis helps identify unwanted frequency components caused by distortion or interference.
- Harmonic and spur checks: In RF and power electronics, it shows harmonics and spurious signals as separate lines that can be measured against a limit.
Key Takeaway
Spectrum analysis helps engineers identify unwanted signals, assess signal quality, and measure harmonics and spurious emissions.
What Tools Are Used for Spectrum Analysis?
Spectrum Analyzers
A spectrum analyzer is designed to measure the frequency components of electronic signals. It measures the magnitude of an input signal against frequency, so each signal component appears at its own frequency. For a fuller description, see what is a spectrum analyzer. Common types of spectrum analyzers include:
- Swept-tuned spectrum analyzer: Sweeps across a selected frequency range and measures the signal level at each point. It is a traditional tool for RF design, service and maintenance.
- Real-time spectrum analyzer: A real-time spectrum analyzer calculates FFTs continuously and builds the spectrum as the signal arrives. Keysight's probability of intercept note calls real-time analysis crucial for detecting, observing and identifying transient signals, and lists the N9021B, N9032B and N9041B among Keysight's signal analyzers equipped for it.
- Vector signal analyzer: A vector signal analyzer captures magnitude and phase, so it can demodulate a signal and measure modulation quality. It is used for demanding work such as designing and testing wireless communication systems.
Oscilloscopes
Digital oscilloscopes primarily measure signals in the time domain, but models with FFT capabilities can also display their frequency components. According to Keysight's Infiniium help, the sampling rate must be at least twice the highest frequency component; strictly, it must be greater than twice to avoid aliasing (see step 1). FFT frequency-bin spacing also depends on the sampling rate and the number of captured points. See the features to look for before buying an oscilloscope.
Signal Generators
A signal generator can produce a tone at a known frequency and send it through a system. A spectrum analyzer can then measure the output to identify changes in signal level or unwanted frequency components. These differences may indicate how the system behaves or reveal a fault, provided you've accounted for harmonics and spurious signals produced by the generator itself.
Software Tools
MATLAB and Python libraries such as SciPy and NumPy include Fourier transform functions for analyzing a recorded signal.
Network Analyzers
Unlike a spectrum analyzer, which measures a signal's frequency components, a network analyzer measures how devices such as filters, amplifiers, cables, and antennas respond across frequency. A vector network analyzer (VNA) supplies its own test signal and measures both magnitude and phase, as explained in the network analyzer versus spectrum analyzer guide.
| Question | Tool | What you get |
|---|---|---|
| Which frequencies does this signal contain? | Spectrum analyzer | Level against frequency for the signal |
| Does a brief event hide in the signal? | Real-time spectrum analyzer | Continuous spectrum measurements that help detect short events |
| What does the waveform look like, and roughly what is in it? | Oscilloscope with FFT | Time-domain waveform and a basic frequency spectrum |
| How does my component respond across frequency? | Network analyzer | Gain, loss and reflection of the component, plus phase with a vector network analyzer |
Question
Tool
What you get
Which frequencies does this signal contain?
Title
Level against frequency for the signal
Level against frequency for the signal
Does a brief event hide in the signal?
Title
Real-time spectrum analyzer
Real-time spectrum analyzer
Title
Continuous spectrum measurements that help detect short events
Continuous spectrum measurements that help detect short events
What does the waveform look like, and roughly what is in it?
Title
Oscilloscope with FFT
Oscilloscope with FFT
Title
Time-domain waveform and a basic frequency spectrum
Time-domain waveform and a basic frequency spectrum
How does my component respond across frequency?
Title
Network analyzer
Network analyzer
Title
Gain, loss and reflection of the component, plus phase with a vector network analyzer
Gain, loss and reflection of the component, plus phase with a vector network analyzer
Which Spectrum Analysis Techniques Are Common?
Common spectrum analysis techniques include:
- Fourier transform: A mathematical method that converts a time-domain signal into its frequency-domain representation. The fast Fourier transform (FFT) is an efficient algorithm used to calculate the discrete Fourier transform.
- Short-time Fourier transform (STFT): Analyzes a small section of the signal at a time, which gives a compromise between time and frequency information.
- Wavelet transform: Uses windows whose length changes with frequency, instead of one fixed window, so its time and frequency resolution vary across the spectrum.
| Technique | Pros | Cons |
|---|---|---|
| Fourier transform | Complete frequency representation | No time information |
| STFT | Provides time and frequency information | One window length sets both time and frequency resolution |
| Wavelet transform | Resolution adapts to frequency | More choices to make (wavelet type and scales), and the plot is harder to read |
Technique
Pros
Cons
Fourier transform
Title
Complete frequency representation
Complete frequency representation
Title
No time information
No time information
STFT
Title
Provides time and frequency information
Provides time and frequency information
Title
One window length sets both time and frequency resolution
One window length sets both time and frequency resolution
Wavelet transform
Title
Resolution adapts to frequency
Resolution adapts to frequency
Title
More choices to make (wavelet type and scales), and the plot is harder to read
More choices to make (wavelet type and scales), and the plot is harder to read
What Are the Steps of Spectrum Analysis?
- Capture the signal. Use an oscilloscope, signal analyzer or similar instrument to capture the signal. When digitizing a signal directly, the Nyquist sampling theorem requires a sample rate greater than twice the highest frequency component to avoid aliasing, which can make high-frequency signals appear at lower frequencies. Many RF spectrum analyzers first mix the signal down, so for them the sampling requirement applies to the bandwidth they digitize, not to the input frequency. Before you connect a signal, check the analyzer's maximum input level in its data sheet.
- Choose the analysis technique. The Fourier transform is a common choice because it breaks a signal into its constituent frequencies. Use the short-time Fourier transform or a wavelet transform when the frequency content changes over time.
- Apply a window function. Apply a window function to reduce spectral leakage, which occurs when a captured signal does not complete an integer number of cycles within the measurement window. This causes energy from a frequency component to spread into nearby frequencies. Common windows include Hann, Hamming and Blackman. The choice depends on the trade-off between frequency resolution and leakage that you can accept.
- Perform the transform. The result shows the frequencies, their amplitudes and, with some transforms, their phase.
- Interpret the results. Look for significant peaks, relate them to source components, and check harmonic relationships. Unexpected frequency components may indicate interference, distortion or signal instability.
What Sets FFT Frequency Resolution and Accuracy?
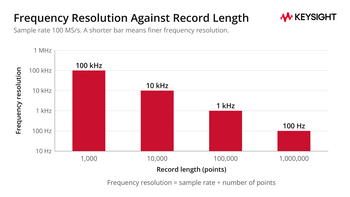
When you use an FFT, frequency resolution depends on the sample rate, record length, and window function. According to Keysight's Infiniium help, dividing the sample rate by the number of points gives the frequency-bin spacing. The window function also affects how well the FFT can distinguish closely spaced signals. Infiniium can add zeros to a record to reach a power-of-two FFT length. This changes the displayed bin spacing but does not improve the ability to resolve closely spaced signals. For an FFT without zero-padding, the bin spacing is:
Frequency resolution = sample rate ÷ number of points
Keysight's Infiniium help identifies 2 contributions to FFT frequency accuracy: an uncertainty of ± half a frequency bin and an additional error from the oscillator that generates the sample clock.
At a sample rate of 100 MS/s, 1,000 captured points give a bin spacing of 100 kHz, while 1,000,000 points give 100 Hz. At a fixed sample rate, a longer capture provides finer frequency resolution, provided the signal remains stable throughout the measurement.
Where Is Spectrum Analysis Applied?
Telecommunications
In telecommunications, spectrum analysis supports designing, testing and troubleshooting communication systems. It lets engineers examine signal quality, measure bandwidth and find sources of interference.
Broadcasting and EMI Testing
Spectrum analyzers help engineers set up and maintain television and radio transmitters by measuring signal bandwidth and checking for unwanted emissions outside assigned frequency bands. Spectrum analyzers also help engineers identify and troubleshoot electromagnetic interference (EMI). For more information about conducted and radiated testing, see what is EMI testing. Keysight offers an EMI measurement application for X-Series analyzers. For receiver measurements to standards such as CISPR 16-1-1, see the PXE EMI test receiver.
How Do You Choose a Tool for Spectrum Analysis?
Start by considering what you need to measure. If you want to identify the frequencies present in a signal, choose a spectrum analyzer. To capture short or intermittent events, look for a spectrum analyzer with real-time capabilities, such as an N9032B PXA configured for real-time analysis. To measure phase and modulation quality, choose a vector signal analyzer. To look at a waveform and get a quick spectrum from the same capture, an oscilloscope with FFT can be enough.
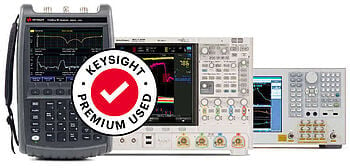
Check the frequency range, installed options and calibration status of each used unit before you buy.
Browse Used Spectrum Analyzers
Frequently Asked Questions
A time-domain measurement shows how a signal's level changes over time. Spectrum analysis shows the strength of the signal's individual frequency components. Both describe the same signal, and the Fourier transform links them.
Yes, with FFT math it can show a basic spectrum of a captured waveform. A dedicated spectrum analyzer is the usual choice when you need a wide frequency range, a low noise floor or fine control of the resolution bandwidth.
Unexpected frequencies can result from aliasing when the sample rate is too low, spectral leakage when a signal does not fit evenly within the capture window, or distortion generated inside the analyzer when the input level is too high. Using an anti-alias filter or increasing the sample rate can reduce aliasing, while applying a window function helps reduce spectral leakage. Increasing input attenuation can also reduce distortion inside the analyzer, although it may raise the effective noise floor.
No. A network analyzer measures how a component responds to its own test signal; a spectrum analyzer measures the signal that reaches it. Many test benches use both.
Common types are the swept-tuned spectrum analyzer, the real-time spectrum analyzer and the vector signal analyzer. See the spectrum analyzer category.
Resolution bandwidth (RBW) is the bandwidth of the filter that decides how close two signals can be and still show as separate peaks. A narrower RBW separates them better but slows the measurement. Video bandwidth (VBW) controls a post-detection filter that smooths fluctuations in the displayed spectrum. On many analyzers, VBW is automatically coupled to RBW by default. Both settings are described in Keysight's help on resolution and video bandwidth.
Whenever You’re Ready, Here Are
5 Ways We Can Help You
1
Browse our used spectrum analyzers
2
Call tech support US: +1 800 829-4444
Press #, then 2. Hours: 7am – 5pm MT, Mon– Fri
3
Contact our sales support team
4
Create an account to get price alerts and access to exclusive waitlists
5
Talk to your account manager about your specific needs
Sources
- Keysight Technologies, Understanding and Applying Probability of Intercept in Real-Time Spectrum Analysis (5991-4317EN): real-time analysis for transient signals and the
- Keysight Technologies, Infiniium help: FFT Measurements: sample rate, frequency resolution and windows.
- Keysight Technologies, E5071C ENA Vector Network Analyzer data sheet (5989-5479EN): frequency options and last order date.
- Keysight Technologies, EMI measurement application technical overview (5990-6035): the EMI measurement application for X-Series analyzers.
- Wikipedia, Nyquist–Shannon sampling theorem
- Wikipedia: Window function
- Wikipedia: Wavelet transform
- Wikipedia: Square wave
- Keysight Used Equipment Store, Network Analyzer Versus Spectrum Analyzer: what each instrument measures.
- Keysight Technologies, Resolution and Video Bandwidth help
- Keysight Technologies: VBW and VBW Averaging help: RBW and VBW, and how video filtering smooths the trace.
- Keysight, Contact Us: toll-free number and hours.