
Synthetic Monitoring for SaaS: How to Independently Verify SLAs
Key takeaways:
- SaaS and cloud vendors often accept ownership but without proportionate accountability for business outcomes.
- The lack of vendor accountability stems from a lack of real-time metrics to measure the actual user experiences of customers and employees.
- Keysight Eggplant Monitoring enables accountability and observability through enterprise SaaS monitoring and cloud performance monitoring.
Your enterprise information technology (IT) leadership has likely considered migrating some on-premise services to a public cloud or replacing them with software-as-a-service (SaaS) products.
Common migration targets include product lifecycle management (PLM) capabilities, enterprise resource planning (ERP) systems, customer relationship management (CRM) solutions, and human resource information systems (HRIS).
Migrations can impair digital user experiences in very tangible ways. Your employees or customers may see long response times, frequent failures during routine tasks, and unpredictable unavailability of functions.
Though felt by users, such impacts may be intangible or even invisible in vendor observability metrics. It often feels like external vendors take on infrastructure ownership without proportionate business accountability.
Find out how you can ensure business accountability from your vendors through synthetic monitoring of SaaS applications using Keysight's Eggplant Monitoring.
Why does traditional monitoring face visibility failures with SaaS and cloud?
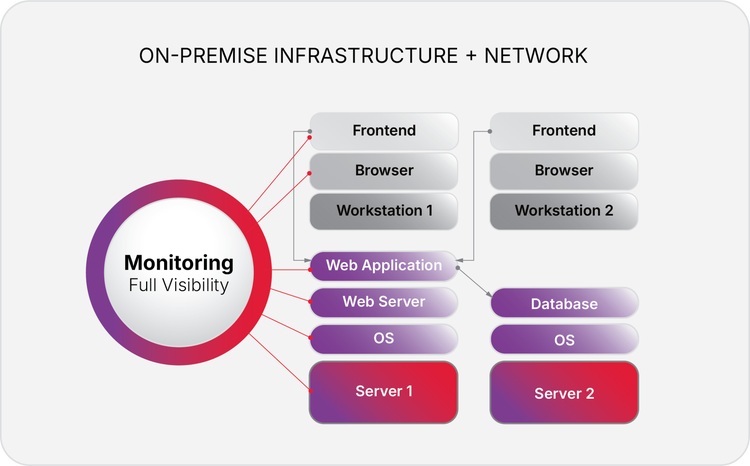
Figure 1. Traditional on-premise deployment and monitoring
Most traditional web application monitoring and application performance monitoring (APM) tools are designed for on-premise environments. They assume that all layers of the hardware and software stack will report metrics with high granularity, enabling deep insights into the entire stack.
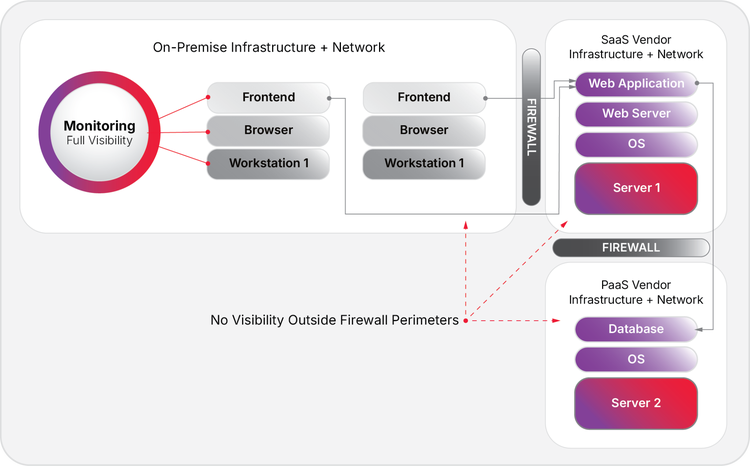
Figure 2. SaaS deployments are invisible to traditional monitoring
But when applications move outside the corporate firewall to a public cloud or SaaS, this fundamental assumption is broken. Traditional monitoring cannot bypass firewall barriers unless the vendor permits them inside.
Information barriers are worse. If SaaS providers don't provide deep metrics of their internal workings, there's nothing for traditional monitoring to measure. As a result, during and after cloud migrations and SaaS adoptions, traditional tools often go blind with massive visibility gaps.
The six R's framework outlines common enterprise strategies for digital transformation, cloud migration, and SaaS adoption. Four of them are relevant to us here.
Rehosting and replatforming
You lift and shift most or all of your on-premise components to a public cloud's infrastructure-as-a-service (IaaS).
Sometimes, a few components, like databases, may be replatformed to cloud platform-as-a-service (PaaS) solutions if the latter have very similar interfaces. However, a provider's IaaS/PaaS cloud monitoring tools don't provide as extensive and granular metrics as your on-premise IT infrastructure monitoring.
Repurchasing
This drop and shop strategy is more common for high-level applications such as PLM or CRM systems. You drop your on-premise application entirely and migrate all capabilities to a fully managed SaaS solution. Existing essential customizations are re-architected for the chosen SaaS.
Most SaaS vendors don't provide deep observability into their services. Only high-level application uptime and availability status are provided. Common problems like latency spikes and random failures for individual customers are neither visible nor documented by the vendor.
Re-architecting
This strategy rewrites a custom complex application into a cloud-native application that uses microservices with third-party PaaS/SaaS dependencies. It combines replatforming and repurchasing, inheriting the visibility gaps of both.
What are common accountability gaps in cloud migration and SaaS adoption?
These technical visibility gaps amplify into major business-level accountability gaps and adverse outcomes as outlined below.
Inadequacy of service level agreements (SLAs)
SLAs are an essential legal tool to enforce accountability on vendors. However, they're far from ideal.
For example, a large public cloud's SLAs only talk about a low-granularity uptime metric and only offer credit refunds for their breakage. You can hold them accountable only if you're able to technically break down your issues as emerging from the vendor's downtime and prove it.
No client-specific metrics or evidence
Vendors provide only low-granularity average metrics across all their customers, such as average uptime and average error rates. Individual customer latencies or failures are not voluntarily reported or documented by vendors, even if severe.
No accountability due to information asymmetry
When any client-specific performance issues occur, the client must technically prove that the root cause is not internal but lies on the vendor's side.
Vendors, on the one hand, don't provide access to your monitoring. At the same time, they also demand technical evidence. This fundamental asymmetry and unfairness lead to unproductive mutual blame cycles without actually resolving the underlying problem.
No real-time insights
Most IT issues start as minor delays or failures. If unaddressed early on, they tend to snowball into major disruptions over time.
That's why your IT teams love real-time alerting.
However, this key requirement is broken in SaaS deployments. Early detection, if any, only happens within the vendor's infrastructure. If they fail to report it in real time to your IT teams, the opportunity to quickly mitigate a business disruption is lost.
Absence of user perspectives
A key deficiency is that vendor SLAs don't measure what's relevant to your users or their user actions. They don't do digital experience monitoring or user performance monitoring as felt by your customers or employees.
Vendors calculate uptime differently from how your users actually experience performance. Latencies during an essential end-to-end workflow may be a major issue for your employees, but the vendor's SLA may only measure uptimes.
No independent verification
Availability dashboards are completely under the control of vendors. Reported values are not independently verified. There are no industry-level bodies or regulators to standardize or verify their data.
Inadequate compensation for disruptions
Most vendor SLAs compensate for issues with refunds or credits. However, their compensation may not match the actual intangible long-term harm due to lost business, damaged reputation, or employee frustration.
Inconsistent user experiences
SaaS vendors don't deliver consistent end-user experiences to all geographies. Your US employees' experiences of a business-critical SaaS may be very different from those in Singapore. These can lead to productivity bottlenecks.
What are good solutions for enterprise SaaS visibility and accountability?
Based on the above problems, a good monitoring approach for SaaS and cloud must have the following characteristics:
- User flow metrics: It must collect metrics relevant to end-to-end business workflows as experienced by end users. These are the metrics that actually define the quality of your customers' or employees' digital experiences. For example, measuring engineering change in PLM, case management in CRM, or order-to-cash workflow in ERP.
- Message-based workflow metrics: Monitoring must include other systems commonly used in modern business workflows, like email, short messaging service (SMS), and mobile push notifications. These are critical in multi-factor authentication, approval workflows, and task completions.
- High-granularity metrics: It must collect user-relevant metrics on availability, user experience (UX), and latency for authentication, landing pages, dashboards, and other key pages.
- Evidential value: The collected data must act as reliable evidence to technically and legally distinguish between internal network issues and provider-side issues.
- Independent verification: The metrics must be independently collected and available as timestamped evidence to present against vendor SLAs.
- Geographical representation: Metrics must be collected from multiple locations to capture diverse user experiences.
- Integrations monitoring: Metrics related to external integrations and application programming interface (API) endpoints must also be collected.
Two common monitoring approaches that can implement these characteristics are:
- synthetic monitoring
- real user monitoring (RUM)
How does synthetic monitoring compare with RUM?
Synthetic monitoring collects metrics by periodically simulating realistic user interactions with a SaaS using scripted automation, while RUM collects metrics during actual user interactions. Both synthetic monitoring and RUM provide insights into different aspects of SaaS interactions.
The benefits of synthetic monitoring are outlined below:
- Proactive detection: It identifies performance bottlenecks, outages, or errors before they impact real customers or employees.
- Data consistency: Because it tests continuously 24/7/365 at regular intervals from fixed locations over reliable connections, it provides consistent, comparable data that is not affected by the variability of real-world internet connections and user behaviors.
- Independent verification: Synthetic monitoring can run from independent external infrastructure outside the firewall to measure and verify vendor uptime SLAs.
- Workflow complexity: It can test complex multi-step workflows and uncommon workflows across diverse technology layers and network perimeters.
The benefits of RUM are listed here:
- Real-world experiences: Unlike synthetic monitoring, RUM can measure performance across a wider variety of real-world devices, browsers, internet service providers, and geographic locations. Synthetic monitoring is like a lab environment that provides reliable, repeatable data for benchmarking and testing. RUM is like a field environment that gives insights into what is actually happening to users in the wild, accounting for real-world variables that synthetic tests cannot perfectly replicate.
- Business impacts: RUM is essential for correlating performance metrics directly with certain business outcomes, such as how page load times affect conversion rates, bounce rates, checkout flows, and revenue of actual users.
- Insights: Synthetic monitoring is preferred for verifying that key business paths are working 24/7. RUM is used to understand the nuances of how performance and responsiveness fluctuate based on real-world user conditions.
The above comparisons show that the two monitoring systems are not alternatives but are complementary.
Why should you choose Keysight Eggplant Monitoring for synthetic monitoring?
Keysight Eggplant Monitoring is Keysight's powerful synthetic monitoring service. Its key capabilities are outlined below.
Fully managed by Keysight
A key differentiator is that Keysight Eggplant Monitoring is a fully managed service from Keysight. No installations or other overheads are required. User journey scripts are written and maintained by Keysight experts.
At the same time, being fully managed doesn't mean it’s inflexible. It integrates with your existing IT infrastructure, including public and hybrid clouds. Customizations for your use cases, script editing, and integrations with your preferred services are possible.
Monitoring of user journeys, web applications, and web pages
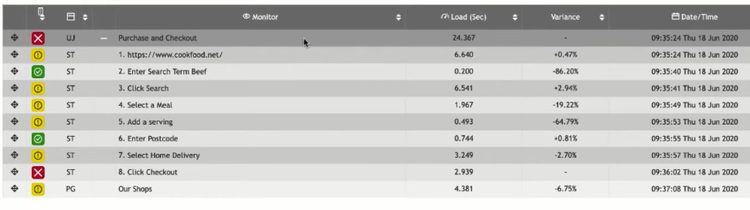
Figure 3. Monitors for user journey and web pages in Keysight Eggplant Monitoring
Keysight Eggplant Monitoring can perform user-perspective testing by automating complex, multi-step user journeys. Various aspects like end-to-end monitoring, transaction monitoring, and middleware API monitoring are covered. It can test across diverse technology layers, including:
- API endpoints
- email servers
- mobile devices
- domain name system (DNS)
- content delivery networks (CDNs), gateways, caching servers, and other distribution infrastructure
- file transfer protocol (FTP) servers
- model context protocol (MCP) servers
It enables comprehensive views through high-granularity metrics for every step in a user journey, providing crucial validation. It can also monitor for website performance optimization.
Independent SLA verification
Keysight Eggplant Monitoring does all its automated testing from independent datacenters. Your issues can be replicated from independent locations and network connections.
All observations are accompanied by auditable evidence, such as timestamps and screenshots. You can back your vendor conversations with irrefutable data and evidence from fully independent monitoring.
Client-side monitoring
By using a real Chrome browser for its automated tests, Keysight Eggplant Monitoring can capture client-side metrics like page load times and first contentful paint to identify web performance and usability issues.
False positives prevention
If there are failures, each is double-checked via a retest to minimize false positives. This ensures that most alerts are triggered only by genuine issues.
Continuous assurance throughout SaaS and cloud migrations
Keysight Eggplant Monitoring enables business continuity monitoring throughout your enterprise's digital transformation, as outlined below:
- Before migration: Your IT teams can establish a performance baseline for your existing on-premise solution.
- During migration: IT teams can detect instability and regression in real time.
- After migration: IT teams can confirm that use case performance has not worsened.
For example, Lloyd's Register uses Eggplant Monitoring to ensure optimal user experiences across their services for the maritime industry.
Real-time alerting

Figure 4. Real-time monitoring dashboard
For every enabled monitor, active monitoring is executed on a regular schedule with a frequency determined by your teams. For example, they can configure higher frequencies for SLA adherence tests and lower frequencies for less critical applications. The service sends alerts as soon as issues are detected, often based on predefined thresholds, long before your users start calling IT. Your teams can configure multiple levels of escalation contacts. Each contact can be alerted through SMS, voice, email, or third-party services (such as PagerDuty, Slack, and ServiceNow).
Mobile app access
The Keysight Eggplant Monitoring mobile apps enable quick visibility for your IT teams supporting global operations.
API access
The Keysight Eggplant Monitoring API enables integration of real-time monitoring with internal management dashboards for SLA compliance, outage detection, workflow failures, and performance trends.
It also enables your IT teams to integrate real-time monitoring with DevOps.
Insightful visualizations and reports
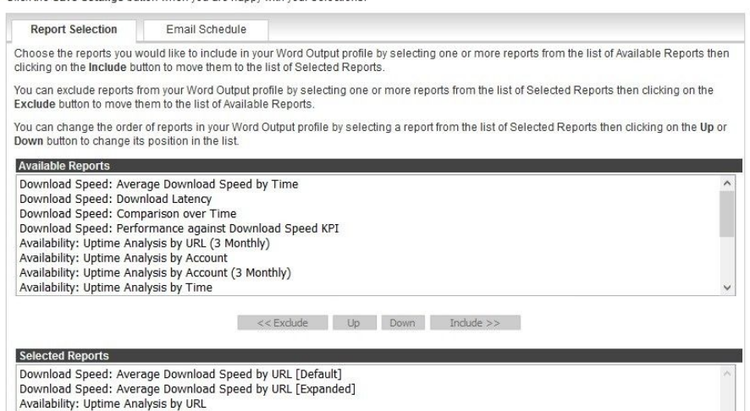
Figure 5. Keysight Eggplant Monitoring reports
Keysight Eggplant Reporting has an extensive set of visualizations and reporting features to facilitate troubleshooting and performance optimizations.
The images below show various visualizations and charts available in the monitoring portal.
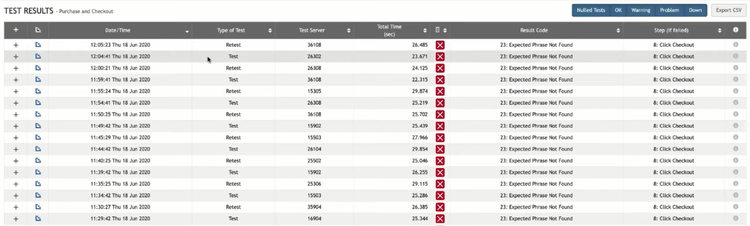
Figure 6. Results of user journey monitoring
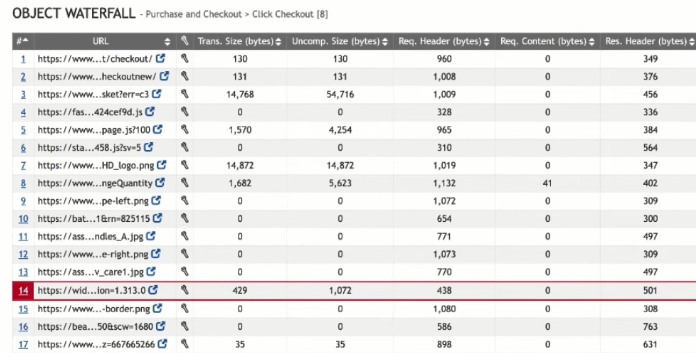
Figure 7. Granular performance metrics from a user journey step
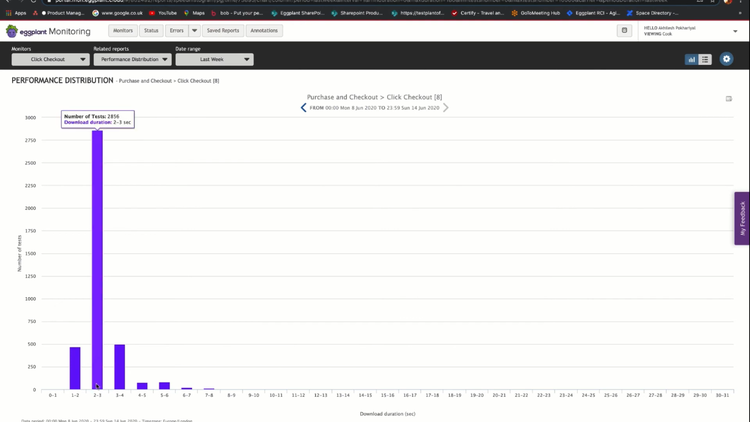
Figure 8. Performance distribution of test durations for a monitor
Rely on Keysight Eggplant for synthetic monitoring of SaaS applications
SaaS vendors provide services without proportionate accountability for business outcomes. Synthetic monitoring tools help to reduce this accountability gap by giving you visibility into end-to-end performance across SaaS boundaries.
Keysight Eggplant Monitoring is a powerful synthetic monitoring solution that facilitates independent assurance for your digital transformation, cloud migrations, and SaaS adoptions.
Contact us to see how Keysight Eggplant Monitoring works and request a demonstration.
Related Posts