Können wir Ihnen behilflich sein?
Network Analysis
Master the fundamentals of network analysis and find the expertise you need for advanced applications
Network analyzers characterize radio frequency (RF) devices. Although they started out just measuring S-parameters, network analyzers have become highly integrated and advanced to stay ahead of the devices they test.
We’ll go over the fundamentals of network analysis, using a network analyzer, and some of the advanced measurements you can make with a network analyzer.
What is a Network Analyzer?
Network analyzers characterize radio frequency (RF) devices. Although they started out just measuring S-parameters, network analyzers have become highly integrated and advanced to stay ahead of the devices they test.
RF circuits require unique testing methods. Voltage and current are difficult to measure directly at high frequencies, so components must be characterized by their response to RF signals. Network analyzers make these characterizations by sending known signals into a device and taking ratio measurements between the input and output signals.
Early network analyzers only measure magnitude. These scalar network analyzers will measure return loss, gain, standing wave ratio, and other magnitude-based measurements.
Today, most network analyzers are vector network analyzers — measuring both magnitude and phase. Vector network analyzers are extremely versatile instruments that can characterize S-parameters, match complex impedances, make time-domain measurements, and more.

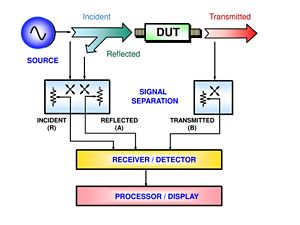
This high-level block diagram of a measurement shows a signal being sent forward through the device under test (DUT) from the input to the output. Measurements that go through a device’s input to the output are called forward measurements.
The network analyzer’s receivers measure the incident, reflected, and transmitted signals to calculate the forward S-parameters.

Key Vector Network Analyzer Specifications
Vector network analyzers are both signal generators and receivers, so they have a large number of necessary specifications. In this section you will learn some of the critical specifications of network analyzers.
Maximum Frequency
A VNA’s maximum frequency is the highest frequency it can measure. Network analyzer receivers contain analog-to-digital converters (ADC) that convert incoming signals into a digital format. These signals can then be analyzed and displayed. The ADC cannot convert signals at radio frequencies, so incident signals must be down-converted to the ADC’s operating frequency. This operating frequency is called the intermediate frequency (IF).
Dynamic Range
Dynamic range is the power range over which the response of a component is measured.
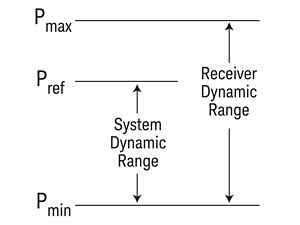
The figure shows two different ways that dynamic range is defined. The system dynamic range is the value used for instrument specifications.
- System dynamic range indicates the instrument’s capability without booster amps and consideration of DUT gain. The instrument's maximum source power is the maximum power level, Pref.
- Receiver dynamic range is the instrument's dynamic range with power amplification. Rather than using the source power as the maximum power level, this specification is based on the maximum power the instrument's receivers can measure, Pmax.

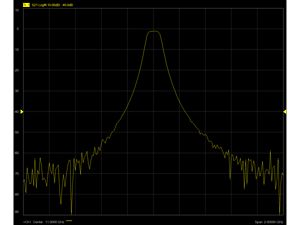
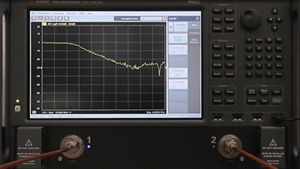
The left figure below shows a trace of a bandpass filter S21 measurement showing the dynamic range of the instrument. The upper bound is flat, and the lower bound is noisy. Let’s look at what determines the shape of these bounds.
The upper limit of the source’s power level and the receiver’s compression point determine the maximum power level of the dynamic range.
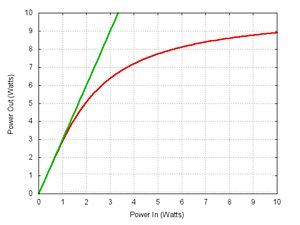
The mixers and amplifiers that make up the receiver can only handle so much power before they saturate, or reach their maximum output. When a device is in its saturation region, there is no longer a linear relationship between the input and the output.
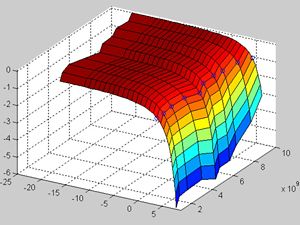
The saturation of an amplifier can be seen in the figure below on the right. Above one Watt of input power, the actual output (red) diverges from the ideal output (green). This phenomenon is called compression. The receiver cannot capture any device output above the receiver’s compression point. This limit of input power creates the upper bound of the dynamic range.


Output Power
The output power indicates how much power the VNA’s signal generator and test set can send into the DUT. It is expressed in dBm and references a 50-ohm impedance to match the characteristic impedance of most RF transmission lines.
High output power is useful to improve the signal-to-noise ratio of a measurement or to determine the compression limit of a DUT.
Many active devices, such as amplifiers, require challenging linear and nonlinear high-power measurements that exceed the power limits of network analyzers.
Trace Noise
Trace noise is noise that you see superimposed on DUT responses because of random noise in the system. It can make the signal look not smooth or even jittery.
Trace noise is mitigated by increasing test power, lowering the receiver’s bandwidth, or by averaging.

Vector Network Analyzer Calibration
RF measurements are extremely sensitive. Test cables, connectors, and fixtures affect the measurement. You want to characterize the DUT; not the DUT and the cables connecting it to the network analyzer.
By default, network analyzers consider the DUT everything beyond the test ports. This consideration means the network analyzer’s reference plane is at the test ports. Everything beyond the reference plane is included in the measurement.
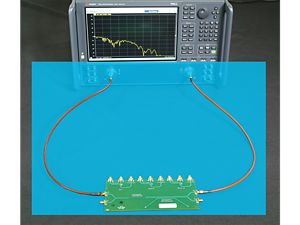
These figures illustrate the reference plane before and after calibration. Before calibration, everything beyond the network analyzer’s ports, including cables and connectors, is included in the measurement.
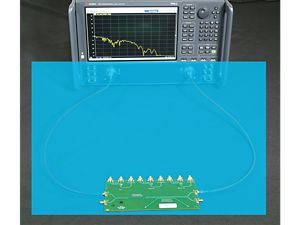
After calibration, the reference plane has moved, so the network analyzer corrects the cables and connectors and only measures the DUT. At a very high level, calibrating for cables and connectors is analogous to zeroing a scale for tare weight.


The two most common methods of calibration are Thru, Reflect, Line (TRL) and Short, Open, Load, Thru (SOLT). These methods are different combinations of impedance and transmission measurements used to characterize the cables and fixtures for calibration.
These calibration techniques involve connecting standards with known properties to the measurement setup in place of the DUT. The network analyzer can apply corrections for cables and connectors by comparing what it measures to the values of the standards.
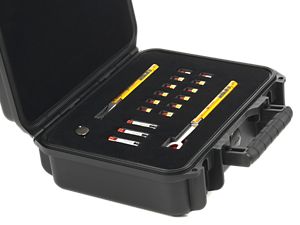
Traditionally, calibration is performed with mechanical standards. Operators would individually make each connection and let the instrument take a measurement. A full two-port calibration requires seven mechanical connections. This process is time-consuming and creates possibilities for user error.
Electronic calibration modules can electronically replicate the different types of loads with just one connection. Electronic calibration is fast, repeatable, and limits wear on connectors.


Vector Network Analyzers and Accessories
To make accurate measurements, you need the right vector network analyzer as well as cables and connectors to connect your instrument to the DUT.
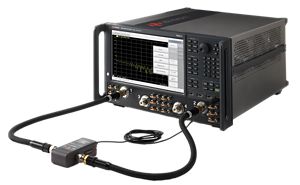
Vector Network Analyzers
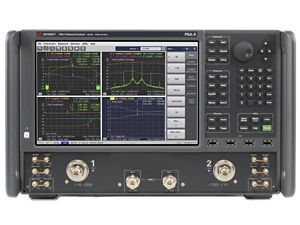
Vector network analyzers range from simple S-parameter tools to highly integrated instruments that can replace an entire rack of equipment. Whether are in the field, metrology lab, or production line there is a network analyzer that provides the right mix of speed, performance, and flexibility.
Keysight offers the broadest range of network analyzer models and form factors — from the portable FieldFox — to the highly integrated PNA.


Connectors
The connections between your instrument and your DUT are critical for reliable measurements. Since RF measurements are so sensitive, you should make sure to consider your connector specifications. Connectors are characterized by three main specifications: characteristic impedance, frequency range, and quality.
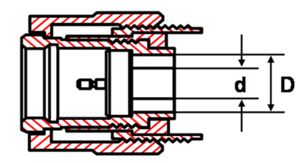
Characteristic impedance and frequency range can be approximated by the connector’s conductor dimensions. Characteristic impedance is a function of the ratio of the inner and outer conductor diameters (d and D in the figure, respectively). It’s important to match the characteristic impedance of your cables and connectors to your DUT to minimize reflection.
Frequency range is related to the inner diameter of the outer conductor (D). The maximum frequency of a coaxial cable can be approximated with the following formula:
maximum frequency (GHz) = 120/D (mm)
For example, this means that a 3.5 mm conductor has a maximum frequency of about 120 / 3.5 = 34 GHz. You’ll need to make sure that your hardware can handle the frequency you need to test. Millimeter frequencies above 30 GHz require connectors and cables with smaller conductors.
When looking for connectors you'll need to know what quality level is appropriate for you. Quality is a measure of the degree of excellence to which the connectors are produced. There are three grades of quality: production, instrument, and metrology.
- Production Grade: Also known as General Purpose Grade, these connectors are intended for economy applications where limited connections and low repeatability are acceptable.
- Instrument Grade: Instrument grade connectors are intended for precision test and measurement equipment where repeatability and long life are primary considerations.
- Metrology Grade: Metrology grade is best suited for calibration applications where the highest performance and repeatability are required. These precision connectors offer the highest degree of certainty in connector impedance.

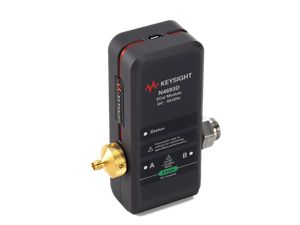
Vector Network Analyzer Accessories
From frequency extenders to test set controllers, network analyzer accessories can turn an instrument into a complete solution.
Hardware accessories can help you:
- Characterize dielectric materials
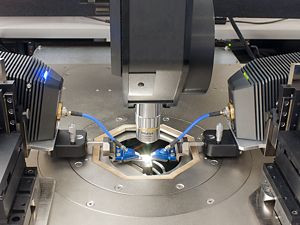
- Test on-wafer devices
- Measure high-power amplifiers and mixers
and much more.

Making Measurements with a Vector Network Analyzer
VNAs are so versatile that a walkthrough for every type of measurement would require its own web site, but let’s look at how the fundamentals discussed here apply to every measurement.
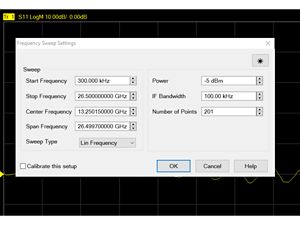
Step 1: Set Up Your Measurement
VNAs make all kinds of measurements, but you’ll usually need to set up some sort of sweep. The main parameters of as sweep are Start and End Frequency, Power, and IF Bandwidth.
Start and Stop Frequency
- These values determine the bounds of the frequency sweep
- Choose values that fully capture your device’s behavior
- Set the center frequency and the span of the sweep if you know where you want your measurement to be centered.
Power
- This value determines the power level of the test signal sent to the DUT
- Use maximum source power for passive devices; for example, filters
- Limit the power to avoid compression in the DUT or the VNA for active devices
- Improve your signal-to-noise ratio with a higher power level
IF Bandwidth
- Choose a bandwidth that gives you the resolution you need at an acceptable speed level
- Use a smaller IF bandwidth for better measurement resolution; the tradeoff is a slower measurement speed

Step 2: Calibrate
Calibration is essential to make accurate measurements, but first, you need to test your measurement setup.
Steps:
- Connect your device and take an uncalibrated measurement.
- Adjust your frequency range and IF bandwidth to confirm you are capturing everything you need to see.
- Confirm the calibration kit has the same connector type and gender as your DUT.
- Connect the calibration kit to your setup to perform the calibration.
- After calibration, you are ready to ready to re-connect your device.
- Re-calibrate if you change the frequency range or IF bandwidth settings.
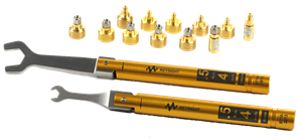
Tip: Use torque wrenches to make the connections to get solid contact between the conductors without damaging them. Only spin the nuts on the connectors; avoid twisting conductors against each other.

Step 3: Interpret Results
VNAs have many software tools to help you analyze your measurements, from 3 dB bandwidth markers to time domain analysis. Choose the right software and features for your measurement to make your analysis easy.
Highly integrated network analyzers such as the PNA have dozens of software applications to address challenging measurements; such as nonlinear and active device characterization.

Vector Network Analyzer Applications
Vector network analyzers are incredibly versatile instruments. The following is a sampling of some of their applications.
Spectrum Analysis
Bringing spectrum analysis onto your network analyzer can significantly reduce test times by speeding up spur searches, eliminating switching between instruments, and taking advantage of single-connection, multiple-measurement (SCCM) capabilities.

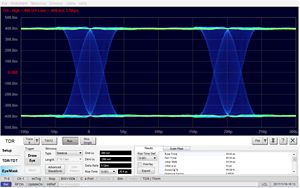
Pulsed Measurements
Network analyzers use a continuous wave (CW) signal in standard operation. While this is useful for many applications, there are certain scenarios where a pulsed-RF signal is preferable, such as:
- Testing antennas designed for pulsed operation
- On-wafer measurements where the heat of a CW signal are a concern
- Time Domain Reflectometry (TDR)
Advanced network analyzers like the PNA support pulsed-RF measurements for these applications and more.

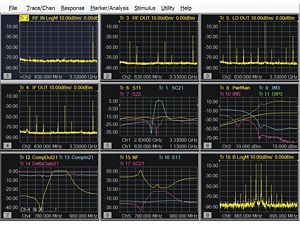
Active Device Test
Modern RF systems are full of active devices like amplifiers, mixers, and frequency converters. Testing these type of devices used to require entire racks of equipment. Now, network analyzers are sophisticated enough to handle active device characterization without additional hardware.
Using a network analyzer instead of a traditional RF test system reduces test time significantly by consolidating all of the measurements to one instrument. Use an integrated network analyzer like the PNA to test:
- S-parameters
- Nonlinear parameters (X-parameters)
- Gain compression
- Intermodulation distortion (IMD)
- Spurs
- Noise figure
and much more.

Want help or have questions?