The statistical simulation technique has become popular for the design and analysis of high speed signals. This is especially true where accurate prediction of random jitter is important, such as in the measurement of eye opening at ultra-low BERs. The limitation of this approach is not being able to model the voltage noise due to SSN (simultaneous switching noise), since the statistical approach assumes the system to be time-invariant so that it doesn’t take SSN effect into account. This paper proposes a solution that extracts the mask correction factor from the voltage noise calculated from a transient simulation, then use it for accurate prediction of eye height and eye width calculation in the statistical analysis. Measurements data is provided to validate the approach.
Due to ever-increasing data rates (or switching speed), and lower supply voltage, DDR memory design engineers are always challenged to increase any noise margin for the system. There are several important noise contributors such as reflections, crosstalk, emissions, ground bounce, and VCC sag. Although the causes of noise mechanism are a little different from each other, they are inter-related and inherently difficult problems to solve. In contrast to SerDes design, DDR4 memory design employs single ended signaling and consists of multiple data lines. By switching every single data line together with the same clock reference, the crosstalk may become a significant noise issue since any switching signals prone to couple to any nearby traces, through packages, and through power rails by inductive and capacitive coupling as well as by sharing the ground return path. This behavior is mainly linear time invariant (LTI) by nature and may be easy to capture by having a good model that represent the coupling between them. In addition to the crosstalk, another important noise contributor is Delta-I noise (or di/dt noise) [1], which reveals a significant noise issue for DDR4.
The simultaneous switching current will induce a noise voltage in the power delivery or distribution network (PDN) by interacting with the frequency dependent reactive impedance on the power and ground planes This noise voltage will then directly impact the pre-driver supply current to the device, significantly varying the eye size due to amplitude and timing jitter noise. The induced noise voltage has three dependencies, first the switching speed of current on the PDN, second the PDN’s inductive reactance, and third the amount of current flowing through. This is complex non-linear time variant phenomena.
These two, crosstalk and Delta-I noise, are significant noise sources for DDR4 designs and are known as simultaneous switching output noise (SSON), or SSN [2] .
For DDR4 systems (up to 3200 MT/s), the inter-symbol interference (ISI) and random jitter (RJ) induced timing margin uncertainties cannot be ignored due to the shrinking unit interval (UI) [3]. In order to take into account for the RJ and ISI effects accurately, JEDEC® introduced the new DQ receiver compliance mask at 10-16 BER in the DDR4 specification [4] as shown in Figure 1.

Figure 1 DQ receiver compliance mask in the DDR4 JEDEC Specification 2012
The new DQ compliance specification requires eye opening at an ultra-low BER level, 1e-16, which poses a new challenge to simulation based design methodology. The traditional simulation approach was based on SPICE-like time domain simulation technologies. Transient Convolution simulation is well known to efficiently deal with cascades of s-parameters, transmission line models, SPICE netlists and IBIS files. However, it is still impractical to simulate millions of bits to calculate ultra-low BER measurement data, due to the speed of the simulation. As you may find from Figure 2, the eye shrinking induced by ISI and RJ is relatively small at low data rates (800 Mb/s). However, the timing margin deceases by 9% UI (15ps) from 103 to 1016 bits because of ISI and RJ effects at 3200 Mb/s data rate system. This proves that time-domain simulation, even with several thousand bits, is far more inadequate to accurately predict the eye opening at 1e-16 BER level. Typical approaches would take the simulation data and extrapolate the timing and voltage bathtub curves, but this extrapolation relies heavily on the quality of the data input. At least several millions of bits are still necessary to do the jitter separation accurately and predict RJ at ultra-low BERs correctly. Several million bits may be practical in measurement, and possible in simulation; however, 1016 bits is not practical in either measurement or transient simulation.

Figure 2 ISI and RJ Impact to the eye opening at different data rates
Statistical Simulation Approach for DDR4
To overcome the limitation of Spice-like time-domain simulations, the statistical simulation methodology was developed, and it has become very essential to DDR4 designs [5]. The statistical simulation approach follows the process below. The first process is to characterize or get the impulse response of the channel, and the transmitters and receivers based on the IBIS models. Then the statistical technique is applied with the statistical distribution of a conceptually infinite non-repeating bit pattern as shown in Figure 3, which allows designers to capture eye probability distributions directly at ultra-low BER without running an actual bit sequence at any desired BER level [6]. Therefore, it offers an extremely fast way of measuring BER contours, even in seconds to get the 1e-16 contour for the JEDEC DDR4 specification.

Figure 3 Statistical Simulation Approach
Figure 4 shows an example for the simulation time comparison, applied to a simple 1-byte DDR4 (8 DQs and 1 DQS) pre-layout channel model. In order to get an accurate RJ extrapolation, Spice-like transient simulation requires at least 1 million bits (1e-6 BER), which takes 4587 seconds (with ADS Transient Simulator) to run, and that is 350 times slower simulation compared to the statistical simulation method (with ADS DDR Bus Simulator).


Figure 4 Eye-Diagram Results By Transient and Statistical Approaches
SSN Challenges with Statistical Simulation Approach
As we discussed in the previous section, we can get the ultra-low BER contours at a fraction of the time required for Spice-like time-domain simulation methods by using the statistical analysis method. Since the crosstalk related noise contribution is linear time invariant (LTI), it is well taken care of by the statistical simulation during the impulse response characterization process. However, the other noise contributor, Delta-I noise is time variant. The dilemma is that the statistical simulation has to be used for calculation of the ultra-low BER contours but the Delta-I noise contribution for SSN is not taken into consideration.
To address this challenge, a practical and efficient SSN induced jitter and noise model extraction method is proposed in this paper. The extracted jitter and noise values will be used to correct the eye height and width calculation at a certain BER level as well as the JEDEC DQ compliance mask to reflect the eye-margin correctly.
Mask Correction Factor Extraction Using Transient Simulation
We define mask correction factor (MCF), which includes the amplitude and jitter noise correction factor, as the difference between the two eye heights, one with and one without Delta-I noise contribution, and same for the eye width. Since we must use the transient simulation to take into account the Delta-I noise for the accurate extraction of the mask correction factor, we first need to decide how many bits we have to simulate for the extraction.
If the amplitude and jitter noise from Delta-I do not increase much by increasing the number of bits, it will allow us to use relatively small number of bits for the extraction of the mask correction factor. Figure 5 is a simple test circuit for this idea, which consists of the power aware Tx/Rx IBIS models for transmitters and receivers, channel, PDN model and voltage regulator module (VRM) circuitry.

Figure 5 Test circuit to determine the required number of bits for the extraction
We ran the simulations with two cases, 5K bits and 50K bits, to see the change of eye height and eye width at a given BER level, 1e-3 and 1e-4 respectively. Figure 6 verify that the Delta-I induced amplitude and jitter noise will not change much with the number of bits used in the simulation, only less than 1% in this case. Since 5K bits only takes 10% of simulation time compared to 50K bits, in this paper we will use 5K bits to extract the mask correction factor to make the extraction process quicker without losing much of accuracy.

Figure 6 Eye Height and Eye Width Comparison Between 5K and 50K bits Transient Simulation
From this result we now know that 5K bits transient analysis will give us reasonable values for the mask correction factor. Let’s examine the extraction process with a 16-DQ line example. We build two test circuits as shown in Figure 7.


|
Figure 7 Schematics setup with Case1 with PDN on the left and Case2 no PDN on the right. |
Both test circuits have a similar configuration that consist of transmitters, channels, and receivers. However, the Case 1 has an EM (electromagnetic) model of PCB PDN and includes VRM circuitry to account for the Delta-I noise contribution and the Case 2 has an ideal voltage source providing a constant voltage supply. With 5K bits transient simulation, we get the following eye diagrams shown in Figure 8.

Figure 8 16 DQ line Transient Analysis with and without PDN
As we expected, the eye is much smaller with the PDN case due to the Delta-I induced amplitude and jitter noise. At the same BER level, the eye width was changed from 396ps to 377ps and 448mV to 423mv for the eye height. The mask correction factor for the PDN induced SSN amplitude and jitter noise can be calculated by the difference between these two values, which result in 25mV for the amplitude and 19 ps for the jitter shown in Table 1.
|
Amplitude Noise Correction Factor |
Jitter Noise Correction Factor |
|
25 mV |
19 ps |
Table 1 Extracted Mask Correction Factor for 16 DQ Line Case
One of the benefits to this approach is the ability to separate the noise contribution, which is not trivial in real measurements. As shown with this example, it is relatively easy process to extract the mask correction factor. This mask correction factor will be used to correct the eye height and width results at a certain BER level as well as the DQ receiver compliance mask margins for DDR4 statistical simulations.
Mask Correction Factor vs. Number of DQ lines
So far, we discussed the challenges for DDR4 statistical analysis and proposed a new and practical solution to address the challenges by modifying the DQ receiver compliance mask using the extracted mask correction factor. Also we exercised the extraction process with the 16 DQ line case. As we discussed before, the Delta-I noise is also proportional to the amount of current flowing through the PDN. The total current will simply depend on the total number of transmitters and receivers switching at a time. It is worthwhile to take a look at the Delta-I noise behavior with the number of DQ lines or transmitters/receivers before we proceed to the full extraction of mask correction factor for 64 DQ lines.
If the bit pattern on every DQ line is the same, meaning that the each DQ line will turn on and off at the same rate, the total current will have linearly proportional relationship since the drawing of current is at the same time point for all transmitters or receivers. Figure 9 verifies our understanding that the total current flowing through the power source is proportional to the total number of DQs with the same bit pattern. Figure 9 shows the switching current waveforms from the power source with 4,8,12,16,20,24,28,32,36,48, and 64 DQs switching respectively. The peak current is close to 1A with a worst case of all 64 DQs running with the same bit pattern.

Figure 9: Switching current waveform with same data bit pattern and with an increasing number of DQ lines from 4 to 64
In the real case, however, the data on each DQ line will have a different bit pattern. Therefore, the total switching current may not show the same behavior. By assigning different seed value for the pseudo-random bit sequence source, we can analyze a more realistic behavior. Figure 10 proves that the switching current waveform is not linearly proportional with the number of switching transmitters and receivers. The peak current is about half of the ‘same bit pattern’ case. Since the extraction of the mask correction factor is easy enough even with higher number of data lines, we prefer to perform the extraction of the mask correction factor with all 64 DQ lines enabled as per the real memory architecture, with different bit patterns, instead of deriving some formulas for the scalability.

Figure 10: Switching current waveform with random data bit pattern and with an increasing number of DQ lines from 4 to 64.
With all 64 DQs enabled with a random data pattern, we can get the eye data shown in Figure 11.

Figure 11 Comparison between no PDN, 16 and 64 DQ lines with PDN
First of all, we can see that the eye is getting smaller with more DQ lines. In this example, the closure for eye height and width are 24mV and 6ps from 16 DQs to 64 DQs.
The mask correction factor now becomes 49 mV and 25ps. We will demonstrate how to use the mask correction factor to correct the eye height and width calculation as well as modifying JEDEC DQ compliance mask.
Solution Validation – Compare Measured vs. Simulated
In this paper, we used the Xilinx® Kintex® Ultrascale™ FPGA platform board, KCU-105, as the validation vehicle of the proposed methodology. The test board is 9.27 x 5 inch PCB and it has 16-layer stack-up shown in Figure 12, where there are 4 256Mbx16 DDR4 SDRAM memory chips from Micron and an XCKU040 Xilinx FPGA chip used.

Figure 12 Xilinx's Ultra-scale FPGA Platform Board, KCU-105
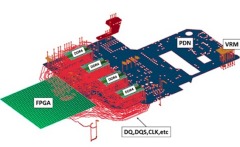
The signal and power connection for DDR4 memory and FPGA chips are shown in Figure 13. A single power distribution network is used to supply the power for both DDR4 and FPGA chips. Each DDR4 has 16 DQ lines.

Figure 13 FPGA and DDR4 Signal and Power Connection
For the validation, we used EM based modeling approach to generate the simulation models for channels (DQ, DQS, etc) and PDN with de-coupling capacitors modeled. The two simulations, one with and one without PDN, were performed to extract the mask correction factor, similar to the previous examples. As shown in Figure 14, it is clear that there is a significant SSN noise contributed by the PDN.

Following the same steps as we did with the previous example, we can find the mask correction factor for the amplitude and jitter noise, which are 94mV and 16ps respectively as shown in Table 2.
|
Amplitude Noise Correction Factor |
Jitter Noise Correction Factor |
|
94 mV |
16 ps |
Measurements were taken using the N6462A DDR4 Compliance Test Application on a DSAV334A Infiniium Oscilloscope [7] from Keysight Technologies and the measurement setup is shown in Figure 14.


Figure 14 Measurement Setup
For the validation, we measured DQ35 among 64 DQs with 109 million bits, which is close to 1e-8 BER contour, at 2400 speed grade. The measured data is shown in Figure 15. The measured eye width was 339ps and eye height 271mV.


Figure 15 Measured DQ35 with 13 million bits at 2400 speed grade.

Figure 16 Statistical Simulation Result for DQ35
If we put the simulated and measured side by side, we can see very nice correlation between the two as shown in Figure 17. The simulated result is a slightly larger eye compared to the measured since no correction for delta-I induced noise contribution is applied to the simulated result.

Figure 17 Side by Side Comparison
First, from Table 2, we can apply the mask correction factor to the JEDEC DQ mask spec to get a new one. After the correction, the new mask specification should be 0.23UI (16ps ~ 0.03UI) and 224mV instead of 0.2UI and 130mV.
|
|
DDR4 DQ Mask in JEDEC Spec |
New DQ Mask After Correction factor |
|
Eye Width |
0.2 UI |
0.23 UI |
|
Eye Height |
130 mv |
224 mv |
Figure 18 is the redrawn of Figure 16 with the corrected mask, where we can see that DQ35 meets the specification even after the correction.

Figure 18 DQ 35 Eye with Corrected Mask
Second, from Table 2, let’s apply the mask correction factor to the statistical simulation results in Figure 16 to compensate the SSN induced Delta-I noise contribution. After the correction, the results become very close to the measured data as shown in Table 3, 2% for the eye width and 2.2% for the eye height.
|
|
DDR BUS Sim Result @ 1E-16 BER |
DDR BUS Sim Result @ 1E-8 BER |
Measurement Result (@1E-8 BER) |
Sim/Mea Difference |
||
|
W/O correction factor |
With correction factor |
W/O correction factor |
With correction factor |
|||
|
Eye Width |
323 ps |
307 ps |
348 ps |
332 ps |
339 ps |
2% |
|
Eye Height |
360 mv |
266mv |
371 mv |
277 mv |
271 mv |
2.2% |
|
|
Conclusion
This paper proposed a methodology, that improves the accuracy of DDR4 statistical simulation, by using the mask correction factor. The extraction process of mask correction factor is relatively simple and quick but still delivers reasonable accuracy while overcoming the limitation of the statistical simulation approach with the SSN induced time variant Delta-I noise. The validated correlation between measured and simulated data proves that this methodology can be effectively used for DDR4 designs.
References
[1] H. Shi, G. Liu, and A. Liu, "Analysis of FPGA simultaneous switching noise in three domains: time, frequency, and spectrum", Proc. DesignCon 2006, Feb. 2006.
[2] James P. Libous and Daniel P. O’Connor, “Measurement, Modeling, and Simulation of Flip-Chip CMOS ASIC Simultaneous Switching Noise on a Multilayer Ceramic BGA”, IEEE Trans on Components Packaging, and Manufacturing Technology, Part B, Vol. 20, No. 3, August 1997.
[3] Penglin Niu, Fangyi Rao, Juan Wang etc. “Ultrascale DDR4 De-emphasis and CTLE Feature Optimization with Statistical Engine for BER Specification” DesignCon 2015
[4] JEDEC DDR4 SDRAM Specification_JESD79-4A, NOVEMBER 2013
[5] Fangyi Rao, Vuk Borich, Henock Abebe, Ming Yan “Rigorous Modeling of Transmit Jitter for Accurate and Efficient Statistical Eye Simulation”, DesignCon 2010
[6] Keysight, “A New Methodology for Next-Generation DDR4 - Application Note”
[7] Ai-Lee Kuan, "Making Your Most Accurate DDR4 Compliance Measurements", DesignCon 2013
[8] Larry Smith and H. Shi, “Design for Signal and Power Integrity”, DesignCon 2007
Authors’ Biographies
Hee-Soo LEE is a master application engineer for SI/PI/3D-EM in the EEsof EDA Group of Keysight Technologies. He has held several different positions in Keysight Technologies, Agilent Technologies, and Hewlett-Packard including field applications engineer, consulting business manager, and marketing application engineer since 1989. Before he worked for Daeryung Ind, Inc. as a RF/MW circuit design engineer. He has more than 28 years of design and simulation experience in the area of RF, Microwave, and high speed designs. He graduated with a BSEE degree from the Hankuk Aviation University, South Korea.
Cindy Cui is an Application Engineer with the EEsof Team at Keysight. She received her Master degree in Micro-Electronic from Tianjin University. She has over 6 years of service and support experience on high speed digital, RFIC design and device modeling at Keysight. Her focus is mainly on DDR4 Design, PCIe, IBIS modeling and the correlation between simulation and measurement. Before Keysight Cindy worked at Cadence for 4 years as the Application Engineer for Cadence simulation platform.
Heidi Barnes is a Senior Application Engineer for High Speed Digital applications in the EEsof EDA Group of Keysight Technologies. Her recent activities include the application of electromagnetic, transient, and channel simulators to solve the challenges of high speed SERDES and parallel bus communication links. Past experience includes 6 years in signal integrity for ATE test fixtures for Verigy, an Advantest Group, 6 years in RF/Microwave microcircuit packaging for Agilent Technologies, and 10 years with NASA in the aerospace industry. Heidi graduated from the California Institute of Technology in 1986 with a bachelor’s degree in electrical engineering. She has been with Keysight EEsof since 2012.
Luis Boluña is a Senior Application Engineer for High Speed Digital Systems and Test Validation for Keysight Technologies. He has extensive experience in both the measurement and simulation of high speed SerDes architectures and backplane designs. His background is Signal Integrity and Mixed Signal Circuit Design. He has worked in Silicon Valley almost 23 years with Cisco Systems, Rambus, Microsoft, and National Semiconductor. His research interests are in system design, testability, simulation, and validation of high speed designs.