Introduction
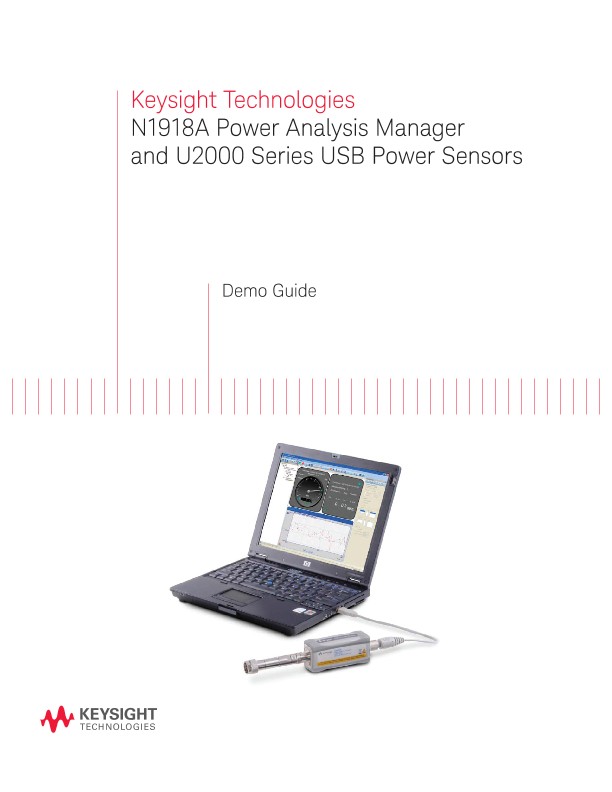
This demonstration guide helps you to get familiar with the basic setup and configuration requirements to perform power measurements using the Keysight Technologies, Inc. U2000 Series USB power sensor via
Keysight N1918A Power Analysis Manager.
All demonstrations exercised in this guide require the U2000 Series bundled application software N1918A Power Analysis Manager–Power Panel, any of the U2000 Series USB power sensors and a Keysight ESG E4438C vector signal generator.
This demonstration guide includes a step-by-step demonstration of basic average and pulse measurements.
Power Panel
The Power Panel is the basic version of the Power Analysis Manager and is bundled with the purchase of a U2000 Series USB power sensor. The Power Panel provides an easy-to-use GUI that offers basic features that can be found in a typical power meter.
Key Features
- Processes and displays multi-channel power measurements (with more than 10 channels simultaneously)
- Provides larger, enhanced visual display, including power versus time graph (trend chart)
- Performs delta and ratio computations between data from two channels
- Saves and restores instrument settings
- Stores up to 10,000 measurement points
- Stores data in comma separated value (CSV) files that are compatible with Microsoft Excel
- Provides up to 10 frequency dependent offset (FDO) tables
- Supports time-gated measurement capability
U2000 Series USB Power Sensors
The U2000 Series USB power sensors are average, wide dynamic range power sensors that can be used with a PC or any selected Keysight USB-based instrument.
Key Features
- Performs power measurements without a power meter
- Offers a frequency range of 9 kHz to 24 GHz (sensor-dependent)
- Provides a dynamic range from –60 dBm to +44 dBm
- Offers internal zeroing capability and external calibration-free measurements
- Allow average power measurement of CW and modulated signals, includingGSM, EDGE, WLAN and WIMAX TM
Demonstration Preparation
The following instruments and software are required in order to perform the demonstrations illustrated in this demo guide:
- Keysight N1918A Power Analysis Manager (Power Panel)
- Keysight U2000 Series USB Power Sensors
- Keysight IO Libraries Suite
- Keysight ESG E4438C Vector Signal Generator
- Connecting and Verifying ESG and U2000 Series USB Power Sensors
Instructions
- Connect the USB sensor to a PC that runs the Power Analysis Manager and the Keysight IO Libraries Suite 14.2 or higher using the USB mini-B connector.
- Connect the other end of the USB sensor to the ESG as shown in Figure 3.
- Go to Start > All Programs > Keysight IO Libraries Suite > Keysight Connection Expert to launch the Keysight Connection Expert application.
- Detect and verify all connected instruments to ensure suc-cessful connections have been established. Right-click on each listed instrument in the Keysight Connection Expert and send the standard *IDN? command to the instrument for identification.
- Once all connected instruments have been successfully verified, launch the Power Panel to begin. Go to Start > All Programs > Keysight N1918A Power Analysis Manager > Power Panel.
- To start using the Power Panel, search for a connected instrument using the options available in the Find Connected Instrument panel.
- Click Find to search for a connected instrument via the sup-ported IO connectivity—GPIB, LAN, or USB options.
- Select the USB sensor and click Connect. The Power Panel is ready to use.
- Select the USB sensor on the Instrument Navigator panel. On the Instrument Properties panel, click Zero to perform zeroing on the USB sensor.
Pulse Power Measurement Demonstration
Pulse power is determined by measuring the average power of the pulse and then dividing the measurement results by the pulse cycle value to obtain the pulse power reading, as expressed by the following equation:
Pp = Pavg / Duty Cycle
The measurement result is a mathematical representation of the pulse power rather than the actual measurement with the assumption of constant peak power. To ensure accurate pulse power readings, the input signal must be a repetitive rectangular pulse with a constant duty cycle.
Objective
To demonstrate the capability of the Power Panel to carry out pulse power measurement using the U2000 Series USB power sensor.
In this demonstration, we supplying a pulsed signal with the pulse width of 10 μs and a pulse period or pulse repetition interval (PRI) of 40 μs. The pulse signal is set to the power level of approximately 0 dBm. The measured average power of the signal is –6.24 dBm (See Figure 6). The duty cycle is known to be 10 μs divided by 40 μs, which is 25%—this value can be configured in the Power Panel. This generates a pulse reading of –0.22 dBm (See Figure 7).
To understand what the USB power sensor does, we can look at the duty cycle calculation. The equation, Average Power = 10 log (Pulse Width/PRI), provides the difference between average power and pulse power. The calculated value in this demonstration shows that the average power is –6.02 dBm lower than the pulse power. The Power Panel makes this correction to show the pulse power using the provided duty cycle.
Oscilloscopes
Analyzers
Meters
Generators, Sources, and Power Supplies
Software
Wireless
Modular Instruments
Network Test and Security
Network Visibility
Services
Additional Products

