Column Control DTX

34830A BenchLink Data Logger Pro Software for Keysight 34970A/34972A

Data Sheets

Introduction

Key features

  • Quick test setup and execution
  • Create multiple scan lists
  • Execute different events based on predefined limits
  • Use advanced math functions
  • Collect, monitor and manage data
  • Present data on a single or multiple graphs
  • Export data to other applications for presentation and analysis

The Keysight Technologies, Inc. BenchLink Data Logger Pro software provides a convenient way to collect and analyze your data. This software is a Windows-based application that uses a familiar spreadsheet environment to define measurement data to be collected. The tab-based format makes it easy to set up multiple scanlists and initiate scans based on predefined limits. Simply identify the measurements you want to acquire, define limits and actions to be performed, and then initiate the process. Your data is then collected, acted on real-time and displayed in table and graphical formats.

With the BenchLink Data Logger Pro software you get advanced data logging and decision making capabilities without spending hours programming.

BenchLink Data Logger 3

Your 34970A/34972A Data Acquis­tion Unit comes standard with the BenchLink Data Logger 3 Software. This software gives you all the basic data logger capabilities including:

  • Easy connection to the PC
  • Set up measurements and scan lists
  • Computed channels and alarms
  • Collection, graphing and export of your data

The BenchLink Data Logger Pro software adds advanced data logging and decision making with no program­ming required. See Table 1 for a list of standard features in both products.

Multiple scan lists

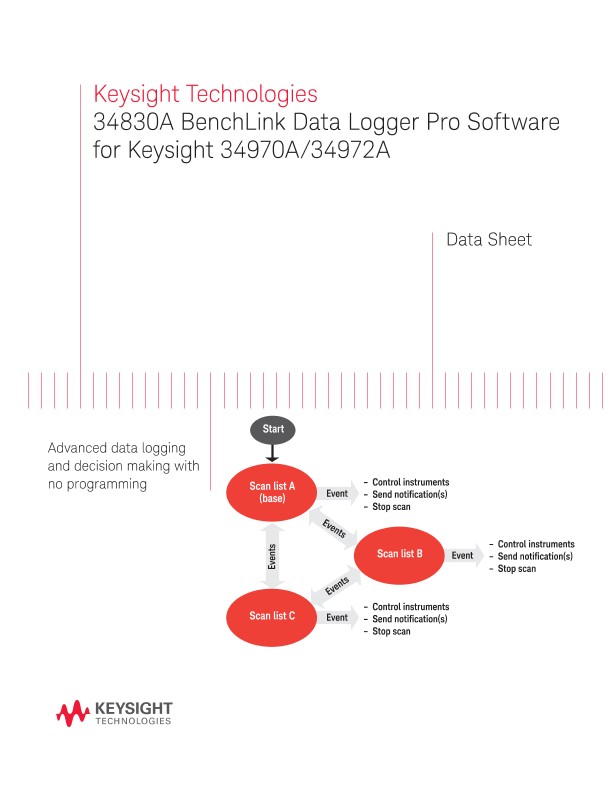
With BenchLink Data Logger Pro you can identify multiple scan lists to be executed based on different limits specified in your configuration.

Setting limits and events

Set limits to identity when to start other tasks. For out of limit conditions, you can specify for different events to be completed.

Scripts can be used to close switches or send DIO within the data acquisition unit, or SCPI commands can be sent to other instruments connected to the PC. For example, when an oven reaches the desired temperature limit, you can start a script. The script can send a SCPI command to the power supply to change the input power to your device under test and switch to a faster scan rate to collect the desired measurements.

For out of limit conditions other notifications such as an audio beep, log events or run an external program can also be performed. See Figure 1

The state diagram feature graphically shows the limits and the order of execution for scan lists, scripts and other notifications. See Figure 2.

Computed channels

Statistical calculations can be added to analyze unique data points. Create computed channels for mathematical relationships with +, –. *, /, dB, dBm, dBV, x2, SRT, full, ½ or 1/4 bridge strain. BenchLink Data Logger Pro adds a calculator function for ad­ditional math functions such as Sin, Cos, Tan and Log. Formulas can also be used for more complex equations including polynomial equations.

Graphing and exporting data

Graph your data, save it to disk, or export it to other applications for further analysis.

Use the quick graph tab to monitor data real time. You can specify multiple channels per graph, or send collected data to multiple graphs.

Use strip charts with markers and alarm indication, or histograms with statistics. The data can be displayed with the auto scale or centered on a common reference point.

×

Please have a salesperson contact me.

*Indicates required field

Preferred method of communication? *Required Field
Preferred method of communication? Change email?
Preferred method of communication?

By clicking the button, you are providing Keysight with your personal data. See the Keysight Privacy Statement for information on how we use this data.

Thank you.

A sales representative will contact you soon.

Column Control DTX