Demo Guide
FM is the most widely used analog demodulation scheme today, therefore this demonstration used uses an FM signal. This demonstration guide shows how to begin the FM demodulation measurement, view traces, use markers, use the speaker to listen to the demodulated signals, observe frequency settling time, and make faster measurements.
Demonstration Preparation
All demonstrations use a Keysight Technologies, Inc. X-Series signal analyzer and the N5182A MXG vector signal generator.
In this document, keystrokes are highlighted in bold text. Keystrokes surrounded by [ ] indicate front panel keys, while keystrokes surrounded by { } indicate soft keys located on the right edge of the display
Connect the X-Series, and MXG
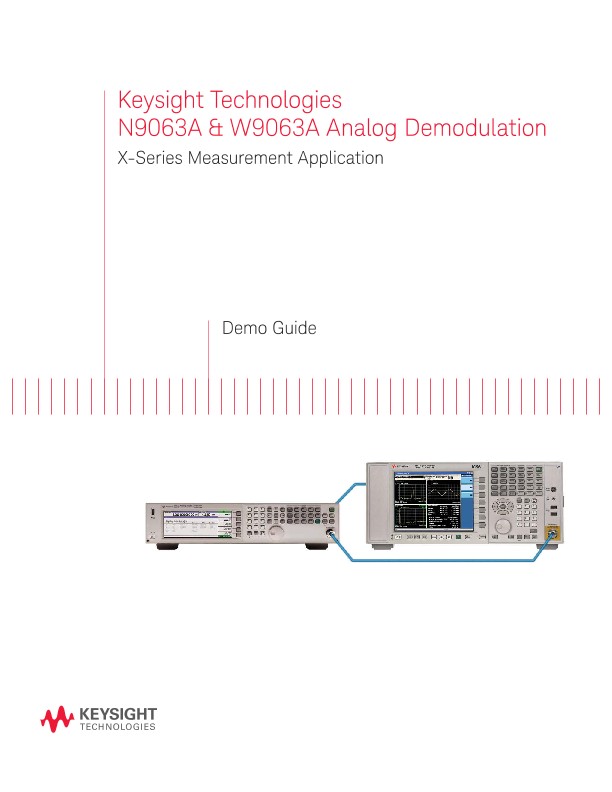
Perform the following steps to interconnect the MXA and MXG
(see Figure 1 for a graphical overview):
A. Using a 50 RF cable, connect the RF Output 50 port on the MXG to the RF INPUT 50 port on the X-Series signal analyzer.
B. Using a second 50 RF cable, connect the 10 MHz OUT on the X-Series signal analyzer to the REF IN on the MXG signal generator
C. Set the signal generator as follows:
– Frequency 2 GHz, amplitude –10 dBm
– FM modulation ON
– FM deviation 1 kHz, FM rate 400 Hz
– Turn RF out and modulation ON
Demonstration 1:
FM demodulation measurement
The quad view shows the RF spectrum, AF spectrum, demod waveform, and the FM demod measurement metrics simultaneously. By watching these traces in the various domains along with the metrics, you can understand the signal characteristics precisely and, especially during troubleshooting, you can quickly and easily identify the cause of a problem.
Demonstration 2:
View traces more clearly While the quad view offers comprehensive results of demodulation with a single display that combines windows of RF, AF, baseband waveform, and demod metrics, there may still be needs to look into each window individually. Individual windows offer a more detailed analysis with the ability to finely adjustment test conditions.
Increase demodulation time
You may see the status message, “Insufficient Data. Increment Demod Time” on the bottom of the display. This is because the current FM rate of 400 Hz is too low for the analyzer to make accurate measurements with the analyzer’s default settings. In general, the demodulation time should be longer than 1/(FM rate), or, in other words, it needs to be longer than at least one modulation cycle.
RF spectrum window
In the upper left corner of the display is the RF spectrum window. This window can be used to show both the modulated signal and any other signals or spurs that may be present nearby.
The two green vertical lines define the demodulation channel bandwidth, showing which part of the RF frequency domain that the analyzer is currently demodulating. The value is also shown on the measurement bar at the top of the display.
Demod waveform window
This window is in the upper right corner of the display. Since the FM deviation is 400 Hz, it cannot be easily viewed on the screen and it will be necessary to adjust the demod waveform amplitude scale.
AF spectrum
AF spectrum is the FFT of demod waveform. The AF spectrum shows the distortion of the demodulated signal very clearly just as the spectrum analyzer does for RF microwave signals. Change the reference level to see the noise floor. Activate the AF spectrum window and change the ref value.
Demonstration 4:
Using the speaker to listen to the demodulated signal
Listening to the demodulated signal through a speaker gives you more insight. Many experts and technicians can figure out the cause of a problem by hearing buzzing, humming, and/or clicking noises.
Demonstration 5:
Observing frequency settling time
FM demod waveform is also a good way to see the frequency settling of the signal of interest. The simultaneous detectors in the X-Series analyzers (max hold/min hold/average/current) give you more insight into the settling behavior of your transmitter output. Let’s take a look at the signal sources aRF output settling.
Demonstration 6:
Making faster measurements
As discussed earlier, you should set the demodulation time as short as possible to capture two cycles of the measurement. Also, by setting the RF span equal to the demodulation channel bandwidth, you can get the fastest measurement speed possible.
In addition, the analog demodulation application has the capability of turning off some measurements that you don’t need to deliver the results much faster.
Oscilloscopes
Analyzers
Meters
Generators, Sources, and Power Supplies
Software
Wireless
Modular Instruments
Network Test and Security
Network Visibility
Services
Additional Products

