Analog Demodulation X-Series Measurement App, Multi-Touch UI
N9063EM0E
– Accelerate measurements with one-button AM, FM, PM and FM stereo signals
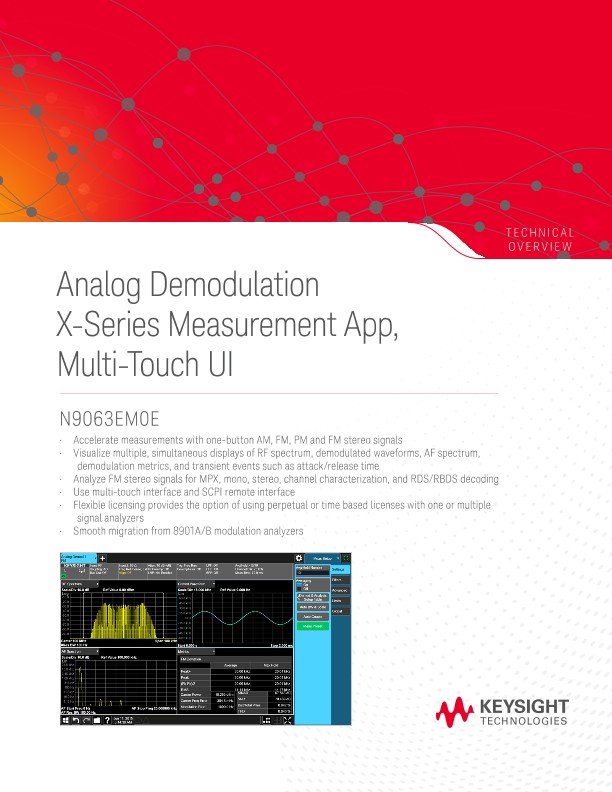
– Visualize multiple, simultaneous displays of RF spectrum, demodulated waveforms, AF spectrum, demodulation metrics, and transient events such as attack/release time
– Analyze FM stereo signals for MPX, mono, stereo, channel characterization, and RDS/RBDS decoding
– Use multi-touch interface and SCPI remote interface
– Flexible licensing provides the option of using perpetual or time based licenses with one or multiple signal analyzers
– Smooth migration from 8901A/B modulation analyzers
Analog Demodulation Measurement Application
The analog demodulation measurement application transforms the X-Series signal analyzer into an easy-to use transmitter tester for analog modulated signals, including AM, FM, PM, and FM stereo. By adding fast, one-button measurements, the analog demodulation measurement application helps you design, evaluate, and manufacture your analog devices quickly and accurately. Even in the modern digital world, the analog demodulation measurement application helps you to troubleshoot distortions due to unintentional, analog modulation from digitally-modulated transmitters -- allowing you to stay on the leading edge of your design and manufacturing challenges.
X-Series measurement applications
X-Series measurement applications increase the capability and functionality of Keysight Technologies, Inc. signal analyzers to speed time to insight. They provide essential measurements for specific tasks in general-purpose, cellular communications, wireless connectivity applications, covering established standards or modulation types. Applications are supported on both benchtop and modular, with the only difference being the level of performance achieved by the hardware you select.
X-Series measurement applications can help you:
– Gain more insight into device performance with intuitive display and graphs for your application. Select from our library of over 25 different measurement applications.
– Ensure that your design meets the latest standard. Updates are made to the X-Series measurement applications as standards evolve.
– Apply the same measurement science across multiple hardware platforms for consistent measurement results over your design cycle from R&D to production.
– Choose the license structure that meets your business needs. We provide a range of license types (node-locked, transportable, floating or USB portable) and license terms (perpetual or time-based).
Top Features
Visualize multiple displays simultaneously
Easily customize a multiple window display. One example is shown on the right. The FM measurement provides the capability of demodulating the frequency modulated signal and displaying the metrics results in graph and table simultaneously.
Monitor RF spectrum
This is the most traditional spectrum analyzer measurement viewing the modulated carrier signal power in frequency domain. Prior to being modulated, the signal power of a sinusoidal carrier concentrates at the carrier frequency. By contrast, modulation causes sidebands indicating the power redistribution over frequencies. The pattern of the sidebands depends upon the modulation format. (Refer to Figure 2.)
Demod waveform and AF spectrum
This measurement retrieves the baseband signal from the modulated signal via the demodulation process, and displays the baseband signal in a pattern of modulation depth/deviation versus time. Because the modulation depth/deviation is directly proportional to the instantaneous amplitude of the baseband signal, the measurement result helps to intuitively evaluate the quality of the baseband signal. (Refer to Figure 3.)
AF spectrum view
By applying the fast Fourier transform (FFT) to the baseband waveform, AF spectrum demonstrates the baseband signal behaviors in frequency domain graphically. This measurement reveals the distortion of the baseband signal clearly just as the RF spectrum does for the RF signal. (Refer to Figure 4.)
Modulation metrics
Besides the frequency domain and time domain view of analog modulation signals, one of the most important features of this application is numeric result that demonstrates the modulation parameters and error information. For AM signal, the AM depth, modulation rate and distortions like SINAD will be displayed in metrics view; for FM/PM signal, the FM deviation/ PM deviation, carrier frequency error and distortions will be displayed. (Refer to Figure 4.)
Osciloscópios
Analisadores
Medidores
Geradores, Cargas e Fontes de Alimentação
Software
Wireless
Instrumentos Modulares
Segurança e Teste de Rede
Network Visibility
Serviços
Produtos Adicionais

