
Accurate EIS Testing with Keysight Battery Test Systems
In my last posting “New Keysight Cell Test Systems Address Low-Current Needs” (click on title to review) I talked about some of the key test capabilities of these new SL1035A/SL1036A low-current cell test systems. One of those key test capabilities is electrochemical impedance spectroscopy, or EIS. I now want to take this opportunity to go into what EIS is, highlight some of the ways on how it is useful for evaluating cells, and finally what is needed for making accurate EIS measurements. These highlights are based on the Keysight white paper “Advanced Electrochemical Impedance Spectroscopy (EIS) for Battery Testing”, which goes into far greater details on the topic than my high-level treatise here. If your interest is piqued from my article, then I encourage you to read the white paper by clicking on its title!
EIS Measurement Principles:
For cells, EIS is the measurement of their complex impedance over a wide band of frequency, from about 1 mHz to 10 kHz. An example of an EIS measurement Nyquist plot is shown in Figure 1. In an EIS Nyquist plot the negative of the imaginary impedance is plotted on the y-axis versus the real impedance plotted on the x-axis. Specific test frequencies are sometimes designated as points on the plot line. As can be seen in the EIS plot here, various characteristic shapes at different frequencies correlate to various physical and electrochemical aspects in the cell, including:
- Inductive effects, plotted below the x-axis, dominate at the highest frequencies.
- Ohmic resistance ROhmic, at the x-axis crossover point, is primarily due to the electrolyte solution. It occurs at about 1 kHz.
- Charge transfer resistance RCT and double-layer capacitance CDL at the interfacial layers between the electrolyte solution and electrode surfaces form a characteristic semicircle above the x-axis, over approximately the 1 Hz to 1 kHz range.
- Ionic diffusion impedance characteristics are observed from about 1 Hz, continuing down to 1 mHz and lower, rising steadily above the x-axis.
Most of the insights of a cell’s characteristics are observed in the range of about 1 mHz to 10 kHz. Beyond this range, it does not typically provide significant additional information and insights.
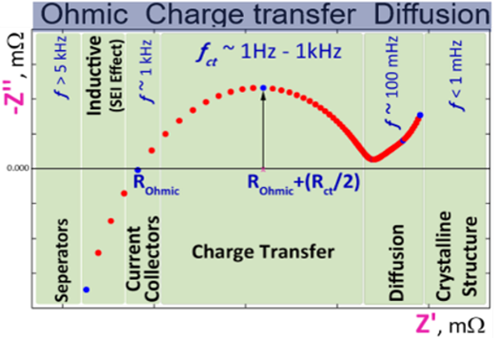
Figure 1: EIS measurement plot on a lithium-ion cell
Electrochemical interface model for EIS:
An equivalent electrical circuit can be fitted to these characteristics of the EIS plot. The most basic and commonly used is the Randles equivalent electrical circuit, shown in Figure 2. Not shown here is the inductive element, which would simply be in series with the ohmic resistance, RSOL. Note that the diffusion impedance is represented by WDIFF. This is referred to as a Warburg diffusion impedance, having somewhat of a non-ideal capacitive behavior.

Figure 2: Randles equivalent electrical circuit
The Measurement Equipment:
The signal generation and measurement capabilities needed to perform the EIS measurements exist within the equipment in Keysight battery test systems (BTS) used for charging and discharging testing. This allows use of the same equipment for charge-discharge cycling and pulse tests, as well as for high-precision measurements including EIS and cyclic voltammetry. There is no need for a separate, high performance (and expensive) potentiostat/galvanostat for EIS testing. The newly introduced SL1035A/SL1036A low-current cell test system, pictured in Figure 3, is an example in the Keysight BTS family that supports EIS measurements.

Figure 3: SL1035A/SL1036A low-current cell test system.
Figure 4 shows a screenshot of the Keysight SL1091A Energy Storage Discover (ESD) control software, when used in conjunction with a Keysight BTS to measure the impedance spectrum of a cell at different SOCs. The left side shows the test sequence, the middle portion shows recorded current and voltage where the alternating charge steps and EIS-test steps are clearly visible, and finally on the right side shows the impedance spectra for the different cell SOC levels as Bode and Nyquist diagrams.

Figure 4: Using SL1091A ESD software and Keysight BTS for EIS measurements
Quantifying EIS plot shifts reveals changes inside the cell:
The internal resistance and AC impedance, as well as the various electrochemical parameters of a cell depend on the state-of-charge (SOC) and the temperature. Figure 5 shows the EIS data acquired at different SOC levels of a cylindrical cell.
From these EIS curves it can be deduced that the charge transfer resistance RCT steadily increases going from low to medium SoC. However, going from medium to high SoC, it reverses and instead decreases. This is one example of how EIS measurements are useful in evaluating changes in cells. It is worth noting that, to get consistent EIS data, the cells must all be charged to the same SoC value before taking EIS data. The same applies when testing cells over temperature, life cycling, and so on.

Figure 5: EIS curves of a cylindrical lithium-ion cell, for different SoC levels
Achieving Precise EIS Measurements:
Cells have milliohms down to fractions of milliohms of impedance, depending on their size. This dictates that the test system should have sensitivity down to microohms for precise EIS measurements. A challenge, however, is the cells to be tested will be remotely located perhaps meters from the test system, most likely mounted to a test fixture in a climatic chamber. The fixtures and cabling connected the test system to the cells introduces large impedance errors. These errors cannot simply be minimized to acceptable levels. But because they are systemic, they can be compensated for with proper calibration.
The Keysight battery test systems, together with the Keysight SL1091A ESD software, incorporate an advanced calibration routine to compensate for wiring and fixture impedance errors. It is based on measuring multiple impedance standards connected to the cell test fixture, to map the errors over the full ranges of impedance and test frequency. This mapping then provides suitable correction coefficients when running EIS measurements on cells, providing precise and accurate results. This process is illustrated in Figure 6.
While the calibration and correction process address systemic errors, it cannot compensate for random errors. Good fixtures and cables are critical to prevent random errors from occurring. This is increasingly challenging as the test frequency increases. This necessitates taking steps including:
- Minimize loop areas in cables. This introduces inductance into the measurement.
- Keep cables rigidly held in position to minimize measurement variability.
- Have fixtures that always hold cells in place in the same position (even 1 mm of variance matters).
Good fixtures and cables, together with advanced calibration techniques, enable the user to achieve accurate EIS measurement results.

Figure 6: Keysight’s calibration and correction workflow for EIS measurements
In Closing:
Research in battery labs is ongoing to optimize performance and energy density, while at the same time assuring long-term life and safety. EIS is a measurement of a cell’s complex impedance over a wide range of frequency. EIS measurements on cells are an indispensable part of this ongoing research, providing insight into how the cell’s electrochemical and physical properties relate to its performance and life, as has been demonstrated here.
The Keysight family of battery test systems (BTS) incorporate EIS measurement capabilities in addition to the test system for cell charge/discharge and life cycling tests. This eliminates the need for separate (and expensive) equipment dedicated to just EIS measurements.
The test system should have sensitivity down to microohms for precise EIS measurements. Keysight BTS together with the Keysight SL1091A Energy Storage Discover (ESD) software incorporates an advanced calibration routine to compensate for wiring and fixture impedance over the full range of impedance and frequency. Together with good fixture and cable practices, it assures precise EIS measurements.
If you found this article of interest, then I again encourage you to read the Keysight white paper “Advanced Electrochemical Impedance Spectroscopy (EIS) for Battery Testing”, that this article is based on as it goes into far greater details. Just click on the title to access!