Keysight Technologies
Pulse Analysis
X-Series Measurement App, Multi-Touch
N9067C
Technical Overview
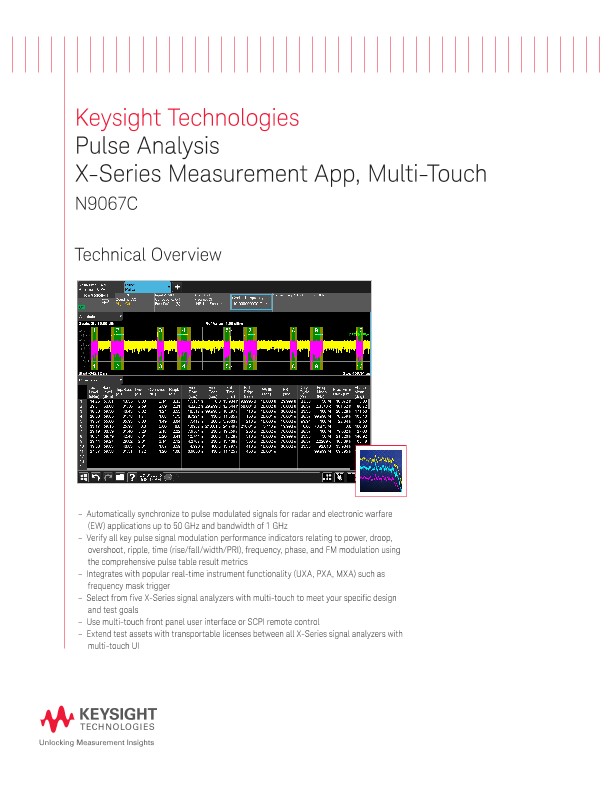
- Automatically synchronize to pulse modulated signals for radar and electronic warfare (EW) applications up to 50 GHz and bandwidth of 1 GHz
- Verify all key pulse signal modulation performance indicators relating to power, droop, overshoot, ripple, time (rise/fall/width/PRI), frequency, phase, and FM modulation using the comprehensive pulse table result metrics
- Integrates with popular real-time instrument functionality (UXA, PXA, MXA) such as frequency mask trigger
- Select from five X-Series signal analyzers with multi-touch to meet your specific design and test goals
- Use multi-touch front panel user interface or SCPI remote control
- Extend test assets with transportable licenses between all X-Series signal analyzers with multi-touch
Pulse Analysis Measurement Application
The Keysight Technologies, Inc. N9067C pulse analysis measurement application for multi-touch signal analyzers provides pulsed radar and electronic warfare (EW) analysis to characterize today’s dynamic signal environment. In mission-critical aerospace, defense and EW applications, signal design and validation require comprehensive tools for pulsed radar signal analysis and cross-domain - time, frequency and modulation - test capabilities. To help engineers achieve their design validation goals, the N9067C, a powerful multi-touch application, integrates with the powerful multi-touch X-Series signal analyzers for comprehensive analysis and troubleshooting. The N9067C populates a diverse set of pulse metrics in a flexible table format. All metrics, including pulse table results, result statistics, and cumulative statistics are easily saved into formats such as .csv for custom reports and post analysis.
X-Series measurement applications
X-Series measurement applications increase the capability and functionality of Keysight signal analyzers to speed time to insight. They provide essential measurements for specific tasks in general-purpose, cellular communications, wireless connectivity and digital video applications, covering established standards and modulation types. Applications are supported across X-Series signal analyzers, with the only difference being the level of performance achieved by the hardware you select.
Top Features
- Verify all key pulse signal modulation performance indicators relating to power, droop, overshoot, ripple, time (rise/fall/width/PRI), frequency, phase, and FM modulation using the comprehensive pulse table result metrics
- Visualize pulse signal modulation characteristics and impairment errors in detail with multiple time-synchronized amplitude, phase, and frequency (FM) trace results, in addition to flexible trace overlay support
- Quickly view statistical variance performance data for each reported pulse metric, accumulated over single or multiple acquisitions, using the pulse cumulative statistics table, graphical histogram, and trend line trace plots
- Gain deeper insights into your signal’s time and frequency domain dynamic and spurious performance with powerful and flexible trace views such as spectrogram and cumulative histo
Pulse analysis in spectrum and time domain with one tool
Traditionally, pulsed RF signals have been designed by radar and EW system engineers using a spectrum analyzer for frequency domain characteristics and oscilloscopes for time domain characteristics. Making other frequency and time domain measurements with exactly the same time-sampled data is one of the simplest, yet most important, vector signal analysis techniques. This is especially true when characterizing transient or non-stationary signals such as complex pulsed RF signals in aerospace and defense applications. The pulse analysis application provides simple setup for pulse detection, comprehensive pulse analysis parameters in various traces with visualization and reporting of test results.
Quickly transition from real-time spectrum analysis to pulse analysis
The indispensable real-time trigger capability offered by the RTSA measurement functionality has been integrated into the N9067C pulse analysis measurement application metrics. Using the multi-window capability, going between 510 MHz real-time analysis and automatic pulse measurements has never been easier.
Variable length gated acquisition allows you to capture pulses with varying PRIs and pulse widths
This detection of pulse rise and fall times in hardware allows for capturing only the pulse you want and not the dead time. Variable length gated acquisition along with scatter plots enable you to see longer trends in data and analyze pulses individually.
Deeper understanding of radar and EW signals with scatter plots
Capturing millions of pulses requires a better way to visualize the enormous amount of data acquired. Scatter plots allow the flexibility of plotting any values of X versus Y such as pulse number versus PRI for staggered PRI radars, chart against frequency to view hopping characteristics and power versus PRI.
Record pulsed signals without having to use any external recorders
Being able to record signals and post process them needs to happen quickly with less setup complexity. The recording feature allows you to capture up to a 4-GB gapless signal without having to configure external triggers, worry about syncing issues and using IQ cables. Used in conjunction with variable length segmented capture enables the recording of just the pulse information without wasting memory on dead time.
Results, statistics & automation
With the N9067C, you can calculate amplitude, time, phase, and frequency, for analog troubleshooting, identification of integration issues and even full system algorithm test. The proprietary high dynamic range wideband ADC built into the UXA and PXA, enables the N9067C to simultaneously determine fast rise/fall times and amplitude parameters such as pulse droop, for cross domain analysis across the entire channel. For example, if there is modulation on pulse, the N9067C can determine the linearity of a chirped signal, auto-detect coding (such as Barker) and display phase shifts in the pulse. Additionally, ECCM activity such as frequency hopping can be measured with each incoming pulse. Using a frequency mask trigger (FMT), the trigger can be initiated at any desired time during the hop sequence.
When analyzing a long data capture, the N9067C can help you identify different pulse modes with time qualified triggers, making troubleshooting a much faster process. The statistics and histograms plots can be used over large acquisition bandwidth to find intermittent issues or verify algorithms over long periods of time.
Oscilloscopes
Analyzers
Meters
Generators, Sources, and Power Supplies
Software
Wireless
Modular Instruments
Network Test and Security
Network Visibility
Services
Additional Products

