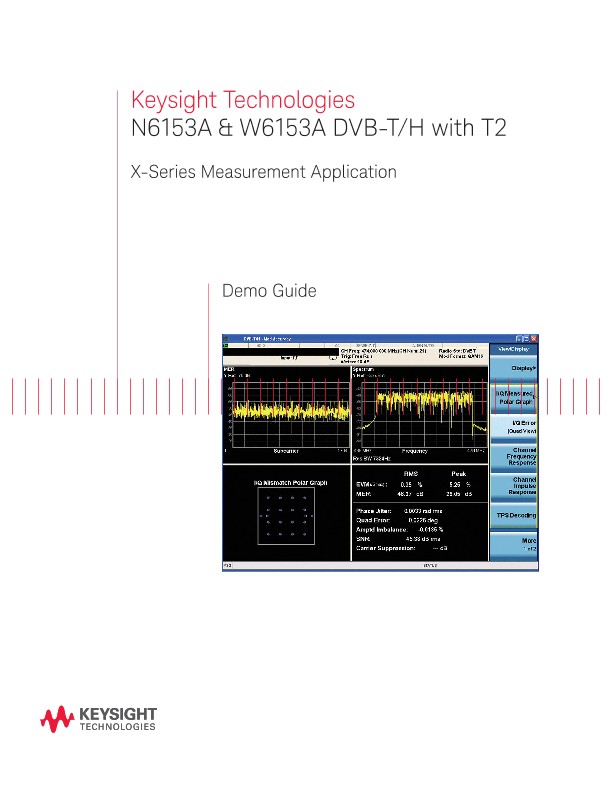
Demo Guide
Introduction
This demonstration guide follows the list on page 2 which shows the functions of the N6153A & W6153A measurement applications. Each demonstration is given a brief description of its function and the corresponding measurement steps on the signal generator and/or signal analyzer.
Measurement Details
All of the RF transmitter measurements as defined by the DVB-T/H/T2 standard, as well as a wide range of additional measurements and analysis tools, are available with a press of a button (Table 3). These measurements are fully remote controllable via the IEC/IEEE bus or LAN, using SCPI commands.
Analog baseband measurements are available on the MXA signal analyzer equipped with BBIQ hardware. Supported baseband measurements include all of the modulation quality, power stat CCDF, and IQ waveform measurements.
Demonstration Preparation
Minimum equipment configuration requirements
The demonstrations below use an X-Series signal analyzer and the N5182A MXG vector signal generator. Keystrokes surrounded by [ ] indicate front-panel keys; keystrokes surrounded by { } indicate softkeys located on the display.
Connect the PC, X-Series, and MXG
Connect a PC (loaded with Keysight N7623B Signal Studio for Digital Video software and Keysight I/O libraries) to the N5182A MXG via GPIB or LAN. Follow the Signal Studio instructions to complete the connection, and then perform the following steps to interconnect the X-Series analyzer (see Figure 1 for a graphical overview):
A. Connect the MXG RF output port to the X-Series signal analyzer RF input port
B. Connect the MXG 10 MHz Out to the X-Series signal analyzer Ext Ref In port (rear panel)
Demonstrations
Demonstration 1:
Set up Signal Studio for Digital Video to generate DVB-T/H/T2 signals
The Keysight Technologies, Inc. N7623B Signal Studio for Digital Video is a Windows-based utility that simpliies the creation of standardsbased or customized DVB-T/H and DVB-T2 signals. The waveform is downloaded into the MXG vector signal generator, which generates RF or IQ signals.
Demonstration 2:
Channel power
The channel power measurement has three views: RF spectrum, shoulder attenuation, and spectrum mask.
The RF spectrum view measures and reports the integrated power in a DVB-T/H/T2 defined bandwidth and power spectral density (PSD) displayed in dBm/Hz or dBm/MHz.
Shoulder attenuation is used to characterize the linearity of the OFDM signal without reference to the spectrum mask.
The spectrum mask view compares the input signal against the spectrum mask defined in ETSI EN 300 744 for the condition of analog TV signal in adjacent channel.
Spectrum mask view
The dynamic range of the RF output of a real DVB-T/H with T2 transmitter typically exceeds the dynamic range of the analyzer. Therefore, the direct measurement result is always “FAIL” and cannot reflect the real RF output.
To measure the spectrum mask of the transmitter’s RF output, there are two methods.
Method 1: When the DVB-T/H/T2 transmitter has an output filter, the diagram for spectrum mask measurement is shown in Figure 7.
Three steps for measuring the spectrum mask are as follows:
A. Measure the frequency response of the output filter using a network analyzer or a combination of signal source and signal analyzer.
B. Measure the signal transmitted at point A.
C. Apply amplitude correction on spectrum value measured in Step B using the ilter’s response from Step A.
Method 2: When the transmitter does not have an output filter, an external filter with a band-block filter frequency response should be added after the transmitter for measurement arrangement.
The steps for measuring the spectrum mask are as follows:
A. Measure the frequency response of the output filter using a network analyzer or a combination of signal source and signal analyzer.
B. Measure the signal transmitted at point B.
C. Apply amplitude correction on spectrum value measured in Step B using the filter’s response from Step A.
Demonstration 3:
Adjacent channel power (ACP)
Adjacent channel power can measure and report the power in one or more transmit channels. The text window shows the total power within defined carrier bandwidth and at given frequency offsets on both sides of the carrier frequency.
Oscilloscopes
Analyzers
Meters
Generators, Sources, and Power Supplies
Software
Wireless
Modular Instruments
Network Test and Security
Network Visibility
Services
Additional Products

