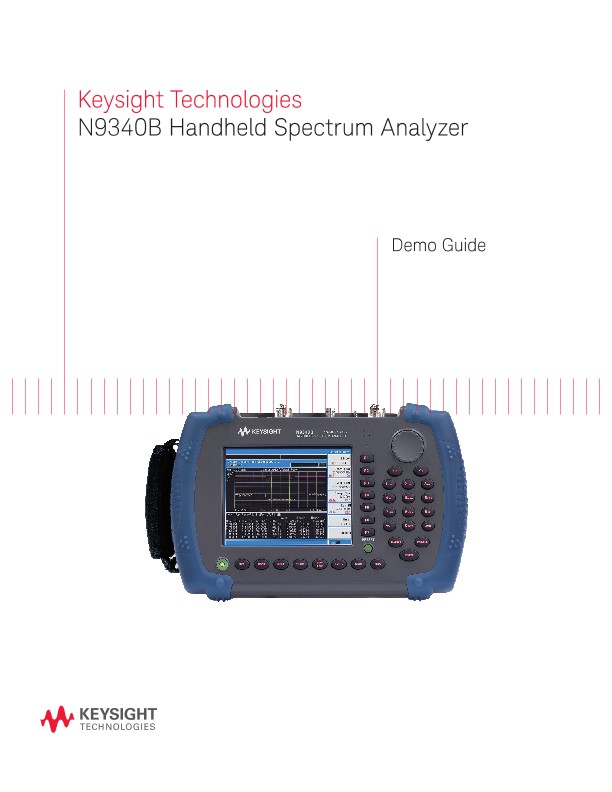
This demo guide is a tool for the new user to gain familiarity with the basic functions and features of the Keysight Technologies, Inc. N9340B handheld spectrum analyzer.
Almost all exercises utilize a signal from an external signal generator with amplitude of –10 dBm and frequency of 100 MHz.
Key names surrounded by [ ] indicate hardkeys located on the front panel, while key names surrounded by { } indicate softkeys located on the right of the display.
Auto-Brightness and Backlit Keys
Communication system maintenance and repair often requires a technician to troubleshoot in bright daylight or in the dark. There is a light sensor on the front panel of the N9340B that measures the ambient light and automatically adjusts the brightness of the display and its backlit keys.
You can also manually set the brightness of the display, and the backlit keys, so they can be seen clearly in any light. The duration of the key light can also be set to maximize battery life.
Save/Recall Setups and Results
A key feature of the Keysight N9340B Handheld spectrum analyzer is the easy-to-use file system.
In addition to the 16 MB internal memory, the Keysight N9340B also allows you to save files to an external USB memory device, such as a USB memory stick
Measurement Basics: Frequency, Span, Amplitude
A typical spectrum analyzer measurement procedure contains the following three steps:
1. First, the center frequency of the analyzer is tuned to the signal of interest.
2. Next, the span is adjusted to zoom in on the signal of interest.
3. Finally, the amplitude is adjusted to give the optimum view of the signal.
In this section, you will set an external signal generator to 100 MHz at –10 dBm and connect an RF cable from its output port to the input port of the N9340B.
Software
If you do not have a signal generator, you can connect an antenna to the input port of the N9340B and perform this demonstration using an ambient signal such as from a local radio station. In this case you may need to jump ahead to Section 6 to learn how to lower the noise floor by reducing the resolution bandwidth (RBW).
Peak Searching and Markers
The peak auto search feature of the analyzer allows you to measure multiple peaks simultaneously. Not only does this save time, it also provides a clear printout of frequency and amplitude data.
If you do not have a signal generator or this signal generator only generates one peak, you can connect an antenna to the input port of the N9340B and perform this demonstration using ambient signals, such as from several local radio stations. In this case you may need to jump ahead to Section 6 to learn how to lower the noise
Measuring Signal to Noise with Delta Markers
Harmonic distortion is present in any electronic system where a signal travels through an active device. Communication engineers are extremely concerned with harmonic distortion. For example, cellular radio systems must be checked for harmonics of the carrier signal that might interfere with other systems operating at the same frequencies as the harmonics.
In this section, the 100 MHz signal’s harmonics will be located using marker delta. The marker delta function allows you to easily compare the frequency and amplitude differences between two signals.
Improving Signal to Noise: RBW, Input Attenuation, Preamplifier and Video Average
One of the primary uses of a spectrum analyzer is searching for and measuring low-level signals (such as the 3rd harmonic of an oscillator). Sensitivity optimization of the analyzer is absolutely crucial when trying to characterize signals of this nature. The input attenuator and bandwidth settings affect the level of signals that can be seen on the display. The attenuator affects the level of a signal passing through the instrument. Narrowing the resolution bandwidth (RBW) fi lter allows you to resolve two or more signals that are closetogether in frequency, and lowers the noise fl oor of the analyzer so you can detect very small signals.
Limit Lines and Pass/Fail Testing: Creating a Mask with Limit Lines
In many onsite test situations, it is necessary to quickly test a signal to see whether or not it meets a specifi cation for frequency and amplitude. For example, during radio transmitter service and maintenance, the technician would want to make sure that the center frequency of a carrier and its harmonic fall within a certain frequency and amplitude mask.
Spectrogram
The Spectrogram shows a three-dimensional display of the spectrum with power over frequency and time. This allows you to locate intermittent interfering signals and identify spurious signals that cause dropped calls and poor service quality in communications systems.
The X-axis represents frequency as in a normal spectrum display, but amplitude is now represented by color, red for a strong signal and blue for noise floor. The Y-axis now represents time, with the trace from the newest sweep displayed at the bottom of the screen. Earlier traces move up toward the top with each new sweep. Two coupled markers allow you to place a marker on any trace in the spectrogram and view the normal spectrum for the time of that sweep. The time interval between sweeps can be adjusted, and up to 1500 traces can be displayed and saved
Oscilloscopes
Analyzers
Meters
Generators, Sources, and Power Supplies
Software
Wireless
Modular Instruments
Network Test and Security
Network Visibility
Services
Additional Products

