How does the noise marker function work on my spectrum analyzer?
Frequently Asked Questions (FAQs)
Summary
The noise marker algorithms are very similar on the 8590, 8560, ESA and PSA series of spectrum analyzers. The main difference is in the type of detection used.Question
How does the noise marker function work on my spectrum analyzer?
Answer
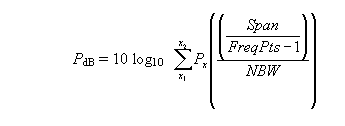
The noise marker algorithms are very similar on the 8590, 8560, ESA and PSA series of spectrum analyzers. The main difference is in the type of detection used. All these analyzers use the following equation to compute the marker noise power:

where the summation is from x1, the left edge point to x2, the right edge point of 0.05 * total span points, centered around the noise marker.
Px is the power ratio of the indicated trace data at point x to the reference level; for example, 0.000001 if x = -60 dB.
Span/FreqPts - 1 is the spacing of the trace data points.
NBW is defined in note 1 below.
8590 and 8560 Series
Access the noise marker function in the Marker Function or Marker menu by pressing
MKR FCTN > MK NOISE ON (859XE) or MKR > MKRNOISE ON (856XE/EC).
When the noise marker is on,
- sample detection is activated,
- total power in the frequency interval is calculated using the equation above
- correction for the RBW filter shape factor is applied1,
- correction for video averaging error is applied2,
- the result is normalized to a 1Hz bandwidth and displayed as dBx (1 Hz)., where x depends on the amplitude units selected, eg. dBm (1 Hz)
For an accurate measurement, make sure that the noise marker is positioned so that all data points are on the noise floor. The data points occupy 5% of the span or almost one horizontal graticule division on the 859XE, which has a fixed 401 display points, and about 1/2 division on the 856XE, which has a fixed 601 points.
1The resolution bandwidth (RBW) filter's near-Gaussian shape is corrected to a rectangular equivalent noise bandwidth (NBW) that passes the same noise power. This correction factor is 1.128 times the 3 dB bandwidth for filters > or = 1 kHz.
2Errors due to averaging the log values of the data points, plus display scaling of noise signals result in a 2.51 dB under-response.
ESA and PSA Series
Access the noise marker function in the Marker or Marker Function menu by pressing
Marker > More > Function > Marker Noise (ESA) or Marker Fctn > Marker Noise (PSA).
When the noise marker is on,
- average detection is activated if Detector is set to Auto, which is default
- average type is set to Power (RMS)4,
- total power in the frequency interval is calculated using the equation above
- correction for the RBW filter shape factor is applied,
- the result is normalized to a 1 Hz bandwidth and displayed as dBx (1 Hz)., where x depends on the amplitude units selected; eg. dBm (1 Hz)
3The average detector type was not available in earlier analyzers. This detector averages all the digitized data in a frequency bucket based on the type of averaging selected. See note 4.
In the ESA, if the RBW is < 1 kHz, sample detection is used.
4Power (RMS) averaging takes the square root of the sums of the squares of the voltage data measured over a bucket interval divided by Zin of the analyzer, so it calculates true average power. If log-power (video) averaging is selected instead by the user, the 2.51 dB under-response error is compensated. In the PSA, voltage averaging may also be selected by the user, and in that case, a 1.05 dB under-response is compensated.